Another attack on my websites

Yet again, my websites and emails have been subject to another attack starting sometime before 10am and ending around 2pm. This time I’ve decided to report the incident to the police.

If anyone else is subject to such attacks, please report them to the police.
This will ensure such attacks are treated appropriately.

Posted in Climate | 2 Comments

Survey: How many years have you worked in science

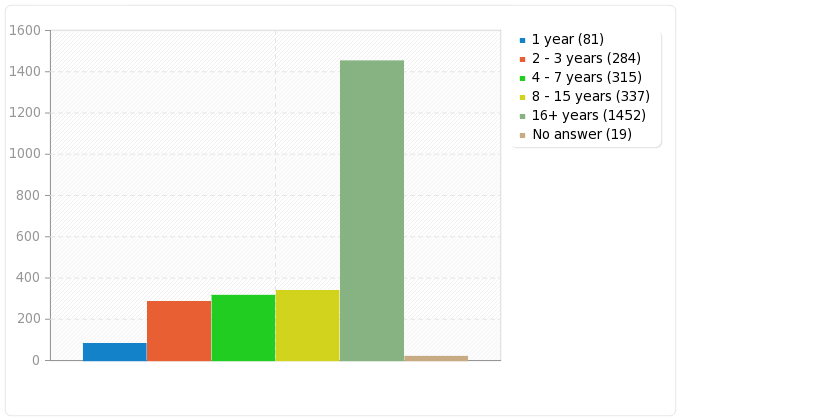
Field summary for Q06
How many years have you worked in science
Answer Count Percentage
1 year (1) 81 3.26%
2 – 3 years (2) 284 11.41%
4 – 7 years (3) 315 12.66%
8 – 15 years (4) 337 13.55%
16+ years (5) 1452 58.36%
No answer 19 0.76%
6763524603f267e023c6be727f863e44


Posted in Survey | Comments Off on Survey: How many years have you worked in science

Fuel Poverty kills Scots

Just back from the Scottish parliament which I attending with Lord Monckton where we attended something called SPREEE. Here we heard three of their advisers starting with WWF.
I repeat: starting with WWF! What on earth are they doing advising the Scottish parliament? Not on how to bread pandas or haggis, but on energy policy! And what were these advisers saying? They were insisting that climate would warm 6C (as a result of Monckton’s questions) and not one of them cared at all about the effects on the hard pressed consumer as not one mentioned the cost to people in Scotland or the harm being done until I got the last question in.
And to cap it all, it was snowing – so I got in the mention about “children won’t know what snow is”.
I couldn’t believe it when the answer came back “it’s cheaper than it would have been if we hadn’t done anything”. Putting up fuel bills by the renewable stealth tax in a country with massive fuel poverty is “cheaper”.
And then I happened to be on the same train as someone else who had gone to the Scottish parliament. They worked for a charity called Energy Action Scotland who deal with fuel poverty.
Apparently 900,000 Scots are in fuel poverty. That’s an utter disgrace. In a country with oil and coal, 900,000 cannot afford to adequately heat their homes.
And what is the Scottish parliament doing on this wintry day? Taling about the real problems facing Scots or the delusional beliefs of the greenblob? They were pandering to the greenblob without a care for the thing that directly impact Scots and kills many of them.

Posted in Energy, greenblob, Politics, Scotland | 19 Comments

Survey: Have you worked in science for more than a year

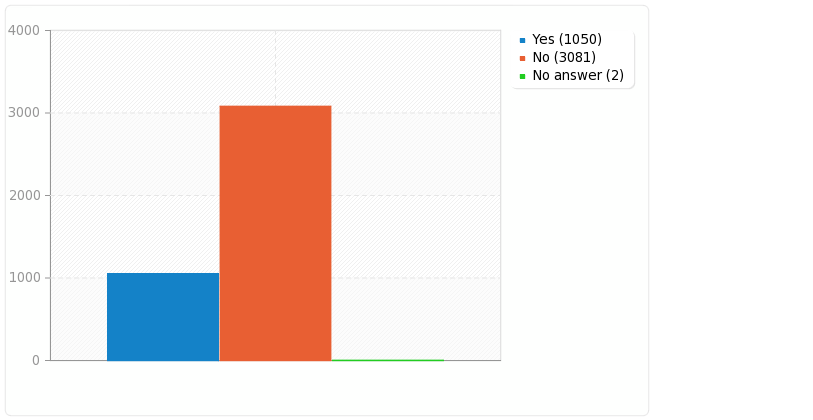
Field summary for Q05
Have you worked in science for more than one year?
Answer Count Percentage
Yes (Y) 1050 25.41%
No (N) 3081 74.55%
No answer 2 0.05%
b84e4039e6b16b54fa7b2c8dd6c2944f


Posted in Survey | Comments Off on Survey: Have you worked in science for more than a year

Greenblobby waste more money = Fastest video fail.

I just love watching these high cost committee produced greenblobbiest videos from the pause deniers to see just how soon they start telling lies. And I did not have to wait long. After the 10s “I did media studies” type intro, the video failed … in 2 seconds flat … on the sixth word:

“Let’s not beet around the rapidly melting ice …”

All their money gone to waste – they can’t be pleased with the latest news:

35 Years Of Unprecedented Mann-Made Melting Has Left Sea Ice Normal At Both Poles


Posted in Fails, Humour | Comments Off on Greenblobby waste more money = Fastest video fail.

Interpreting graphs, blurred vision, Lewandowsky and unReal Climate

I was reading Bob Tisdale’s blog Absolutely Amazing! A Climate Scientist Writes a Blog Post about… in which he discusses a post on unRealClimate, in which unRealClimate discuss Anthony Watts blog’s widget. (right)
And I was looking forward to seeing how they would replace the widget. Obviously it would turn from blue to red, their graph would highlight 1970-2000 and “hide the pause” afterwards, etc.

Lewandowsky

Continue reading

Posted in 1/f, My Best Articles | Tagged , | 6 Comments

Introduction to 1/f climate noise

Time and again I hear nonsense from people saying climate signals are, or are not, “significant”, by this they suppose they mean “cannot be normal”.  But they ignore the fact that in order to say whether or not something it abnormal, we must know what is normal. And they do not know what is normal but assume a model of “normality” which is totally wrong for the claimate. So I decided to write this explanation of 1/f climate noise to help explain the difference.

uBurns.com

It’s often easier to see something that for someone to explain it. So it might help to have a look at the demo of 1/f noise I have at  uburns.com (I’ve jokingly portrayed this as a “forecast” but it just generates noise similar to climate noise. Further info is on the about page. I’ve got some results showing how variance increases: Statistics of 1/f noise – implications for climate forecast. And I’ve even collected together a few examples of how 1/f noise causes errors in interpreting data even by sceptics: Natural habitats of 1/f noise errors.
Also for a wider perspective of how we need to know the underlying variation in order to know what is meaningful see: Lies, damned lies, and statistical significance of climate trends
Empirical_Rule

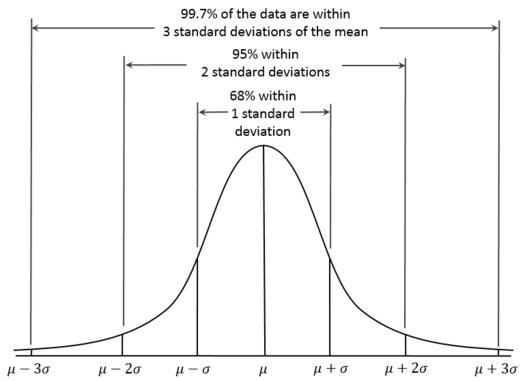
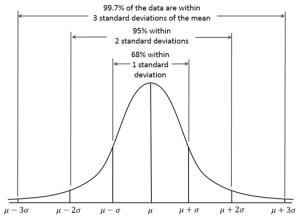
Fig 1 so called “normal distribution”

Normal Variation

The so called “normal distribution” shown right is arguably one of the worst concepts in the whole of mathematics and science. I suspect is the single biggest cause of the failure of climate academics to comprehend why they can’t predict the climate.
Continue reading

Posted in 1/f, My Best Articles | 3 Comments

Survey: Areas of post-school education & training

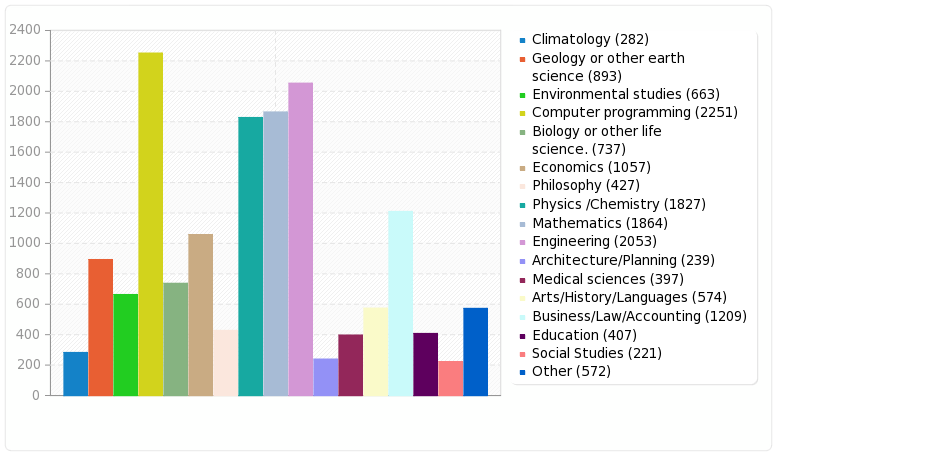
Field summary for Q04
Please tick any of the following areas where you have received formal post-school education or training
Answer Count Percentage
Climatology (a05) 282 5.04%
Geology or other earth science (a01) 893 15.97%
Environmental studies (a02) 663 11.86%
Computer programming (a03) 2251 40.27%
Biology or other life science. (a06) 737 13.18%
Economics (a07) 1057 18.91%
Philosophy (a08) 427 7.64%
Physics /Chemistry (a09) 1827 32.68%
Mathematics (a10) 1864 33.35%
Engineering (1) 2053 36.73%
Architecture/Planning (2) 239 4.28%
Medical sciences (3) 397 7.10%
Arts/History/Languages (4) 574 10.27%
Business/Law/Accounting (5) 1209 21.63%
Education (6) 407 7.28%
Social Studies (7) 221 3.95%
Other 572 10.23%
aeebead45d821db026007c3b40e41bec


Posted in Survey | Comments Off on Survey: Areas of post-school education & training

Natural habitats of 1/f noise errors.

I’ve been collecting a few interesting curves from the 1/f generator at uBurns.com and here is a selection showing the kinds of features that are typical of 1/f noise and which we regularly see being mistaken for “something”.
Note
First all references to “forecasts” is just my attempt at humour. It is 1/f noise, but such noise makes it impossible to forecast and it’s ridiculous to attempt to do so.
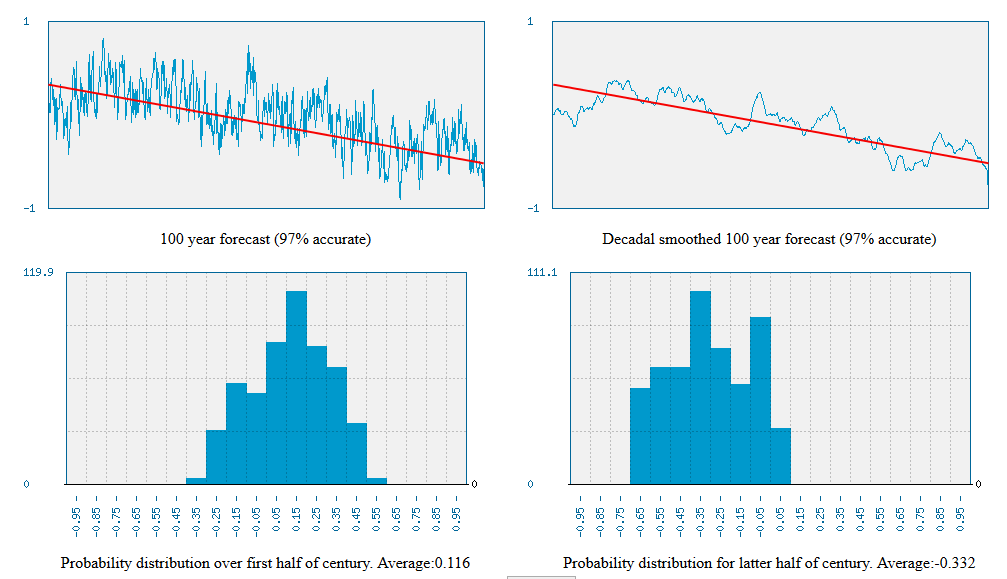
The plots are:

  • Top left: simulated raw data 1/f noise (equivalent to yearly global temperature)
  • Top right: Smoothed raw data (equivalent to decadal smoothed global temperature)
  • Bottom left: distribution of first half of raw data
  • Bottom right: distribution of second half of raw data.

Habitat of error: IPCC report and almost every alarmist website.
A very common characteristic of 1/f noise is that there will appear long-term trends. These are just the coincidental juxtaposition of smaller trends which happen all to go the same direction, but they clearly confuse some academics who cannot understand that such trends are perfectly natural.

1trend

Continue reading

Posted in 1/f, My Best Articles | 4 Comments

Statistics of 1/f noise – implications for climate forecast

Across at uBurns.com, a slow trickle of people have been looking at the page giving me a total of 221 page views. So, I thought there was enough data to do some preliminary stats.
First to recap: the climatic temperature data has a 1/f frequency response showing that natural variation can be modelled by 1/f noise. So assuming all the variation is natural we should be able to model climate with 1/f noise. But little has been written on the statistics of 1/f so it is difficult to know how it will behave. So, I have created a simple 1/f noise generator at uBurns.com and am using this to get data.
To do this, I’ve split the 1000 or so data points of each trial into 16 “buckets” and recorded the average value and slope of each bucket for each trial.
The predictions I made were as follows:

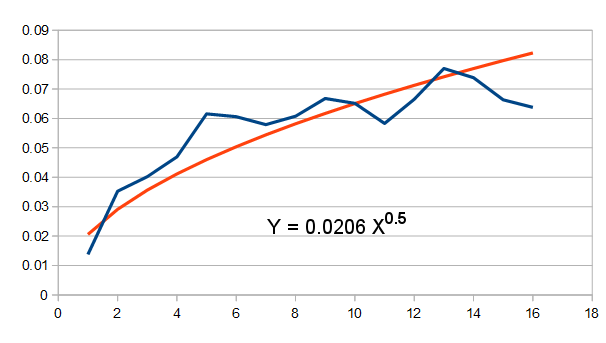
Variance increases proportional to square root.

trial221var
As predicted the variance (sum of squares) of the 1/f noise (shown above in blue) increases with each successive “bucket” so that the increase is proportionate to the square root of the number of points (or in this case buckets). It’s not a perfect fit, but it looks like it’s heading that way. Continue reading

Posted in 1/f, My Best Articles | 4 Comments