The way global warming works is complex and multifaceted, and no single model will encompass all the effects neatly into one package. However there are two simplifications in common use. One (the heat trapping model) presents a view of a change in CO2 as changing the rate of heat flow thus “tipping” the planet into runaway warming. The other (effective radiation height) is a more physically accurate description and within that model a small change in CO2 increases the effective height of radiation from the planet. Because temperature changes with height that results in a colder layer emitting and less heat flow. The change in effective radiation height of doubling CO2 is small (about 100-200m) is reversible and the result of the change is a new equilibrium. In other words a stable planet without runaway warming.
So, on the one hand we have the heat trapping model that implies irreversible runaway warming. On the other the effective radiation height which implies a reversible change to a new stable temperature.
And once you know that, it is not surprising given the known tendency of climate academics to push the environmental agenda, that they overwhelmingly favour the less scientifically rigorous “heat trapping” model. And to be blunt, the heat trapping model has some glaring scientific contradictions such that it is not really something that ought to be read about outside a primary school kids introduction to the subject.
So, I find it incredibly surprising that some Sceptic bloggers, even when presented with better models, hang on to the heat trapping concept like some drowning man. No wonder they get into such heated debates with people like the “Skydragon slayers” – and why push a bad quality model that does nothing except help to push the runaway warming ideas. [Rant end]
The Importance of the Ice ages in creating the academic view of CO2 as a massive driver of climate change.
However, whilst academics are wrong to use the less rigorous model when at least some of them know there are much better models out there, they are right about one thing: it is difficult** to explain historic temperature changes of the earth without explaining how there is a change in the Greenhouse effect (or at least the net flows into and out of the earth**).
So, when we look at the ice-age cycle as shown right:
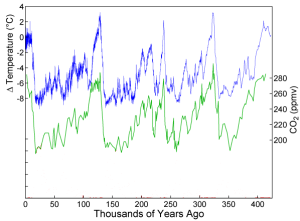
CO2 and Temperature as derived from Vostok ice core (shown with time going forwards).
We see a massive change in temperature (~8C) with a correspondingly small change in CO2 concentration. (80ppm or 33%).
As I explained in a
previous article there are many different things that add up together to give us the warming we call the greenhouse effect, but what we can say, is that if we see a change in the temperature of the earth as we see over an ice-age cycle, then the culprit must be one of those effects I describe. Therefore it is right to say “something must have caused it” … at least on very long term changes. (short term over centuries, we can explain changes by things like changes in flows into and out of oceans – but whilst the heat sink of the oceans are large, over long periods its affect averages out).
So, the 8C must have a cause, and it appears very likely that the cause is a change in the Greenhouse effect. And not having any other explanation to hand, it is not surprising that many academics have mistakenly believed that a minuscule change in CO2
must in some way be implicated with the massive change in temperature over the ice age cycle.
This in short, is the “foundation of their faith”. They don’t understand how CO2 could have driven the ice-age cycle, indeed they appear very embarrassed they don’t know how CO2 is presumed to have caused the warming and they know that CO2 levels rise after it starts to warm which makes it all the more embarrassing for them- but without any other explanation, they grasp at straws and so are driven to believe that CO2 must have a far far bigger affect than the scientific facts about the radiative properties of CO2 would suggest.
And this I suggest is one of the reasons the academics have fought so fiercely to uphold what to most informed & educated people looks an apparently totally absurd notion of massive warming from CO2. It’s not that academics have no reason for so vehemently pushing the CO2 meme – it’s more that they are extremely embarrassed to admit that their whole faith is based on something they don’t understand: the ice-age cycle and how it seems to implicate CO2 in massive warming.
The Caterpillar Theory
A few years ago I realised that warming and cooling of the crust would lead to crustal expansion and contraction that was bound to modulate tectonic plate movement. Then last year, I finally decided to try to understand the role of that effect in the ice age cycle. The Caterpillar theory provides a mechanism to explain why ice-ages take so long to happen (it’s to do with the 1000s of years it takes surface changes in temperature to penetrate the earth), it also explains why a small change in the Milankovitch cycle can trigger the event. What however it does not explain is how expansion in the crust can lead to warming.
So, I started thinking – and by far the most obvious candidate was CO2. However this is where I made a mistake, because thinking that an awful lot of academics had done an awful lot of work on CO2, I assumed it would be pretty easy to connect a rise in CO2 to warming …
So, I didn’t look at the CO2 changes over the ice-age cycle until the end, but instead wrote up the rest of it in a series of articles. Then I got around to writing up the “CO2 warming” part (I was assuming a massive change in plant growth and increases in water vapour – a very powerful greenhouse gas). Unfortunately, far from finding it easy to link CO2 to warming, I found the reverse. There were clear instances where temperatures had varied massively with no equivalent change in CO2.
CO2 was NOT the driver of the ice-age cycle. (And boy was I really miffed!!)
However, by then, I had found very strong evidence that Mid Atlantic ridge formation was being modulated by the ice age cycle.

Fig XX Bathymetric and ice-age cycle (CO2) data normalized to a aximum amplitude of 1, and
superimposed
Thus it was extremely likely that the caterpillar effect was real and therefore implicated in some way into the ice-age cycle. The problem, was that I no longer had CO2 to tie up the Caterpillar effect (thermal expansion of the crust) to climate: I had no way to explain how tectonic plate expansion and the associated increase in volcanic emissions could result in the massive warming we see at the end of the ice-age.
Change to Atmospheric Pressure
For the final piece of the Jigsaw, I have to thank a group of people sometimes called “Skydragon slayers” who have correctly highlighted that atmospheric pressure is the main factor contributing to the Greenhouse effect (but some of whom have wrongly stated this means greenhouse gases like CO2 are not also part of the equation).
However, based on their prompting – and separate from the ice-age research – I started digging around to try to understand the real physics behind the greenhouse effect. I finally worked out the alternative “effective radiation height” model (only to later find out that it was already known in academia but for the reasons I stated at the beginning is not one they would like the public to hear). So, it was not so much a new model to science, instead it was a new model to sceptics and the public.
However, it was the key to unlocking the explanation of the ice-age cycle. Because if CO2 is not the primary cause of the ice-age cycle, and having examined all other likely effects, after working out the physics of the Greenhosue effect, I then understood how atmospheric pressure was by far the biggest factor affecting the greenhouse effect … and that meant I then had to consider it as a possible driver for the temperature changes we see over an ice-age cycle.
However, I started very tentatively because the idea seemed a bit ridiculous. I knew almost no gas could escape from the atmosphere and I also knew of no evidence that atmospheric pressure had changed even over the ice-age cycle let alone was currently as the theory would predict.
Nether-the-less I started looking at the scale and possible implications. And it turns out that a change of around 300mb is enough on its own to cause all the 8C temperature change. Given that we know CO2 would also add to that warming, that H2O was another potential contribution, that changes in ice-cover would also help. The 300mb is an upper limit to what is needed, but as no other effect was sufficiently large, it appeared atmospheric pressure change must have been the cause.
But, without evidence of current pressure change – it was just a speculative idea that I could not expect to be taken very seriously. Then yesterday I finally found evidence for recent long-term pressure change:

Historic global annual mean atmospheric pressure at sea level between 1916 and 2007
Better still, the change of around 1mb/century is right in the ballpark (I was predicting ~0.5mb/century) What this means is that there is now a very plausible – indeed very likely correct – explanation of why we see the massive temperature changes through the ice-age.
Ice ages are primarily the result of atmospheric pressure change and that ~1mb/century change we see in the above graph is the smoking gun.
And down comes the global warming
The main reason academics have been fearful of CO2, is because they had no other plausible explanation for the massive change in temperature over the ice-age cycle other than to some how implicate CO2. To turn that around: unless or until someone could explain the ice-age cycle without implicating CO2, CO2 had to be the cause of massive temperature changes.
However, now I have a full explanation and evidence to back it up showing that pressure can cause the changes seen over an ice-age cycle and that it is currently changing at a rate that is more than enough to cause this change, we now have an alternative explanation that no longer requires CO2.
That’s it! Break the need to invoke CO2 to explain the ice-age cycle, and the main reason to implicate it in massive climate change disappears – end of global warming as a scare. It is that easy!
Isn’t Mike Haseler being a bit presumptuous – surely with 100s or 1000s of academics looking at climate, one would have thought of this?
Normally, that would be a very good argument. Statistically the chances of one individual finding something as important as this in a field with 100s and 1000s of full time academics is small.
However, in the case of climate, we’ve only had the evidence proving the theory fairly recently – and unfortunately that evidence came just in the period of greatest focus on CO2 as the driver. So, whereas there may be 100s or 1000s of people in climate, non of them were seriously looking at anything else other than CO2 as the cause of massive temperature changes.
I was just lucky that by pure chance I happened to come from a sceptical point of view to look at the ice-age cycle. That meant that whilst as a scientist I was obviously willing to look at the evidence for CO2 as a potential driver, as a sceptic I was also willing to look at other possible effects (not currently being considered by academia) like Atmospheric pressure.
In other words: I was just lucky that all the other people who were arguably in a far better position to spot this … were otherwise occupied.
**In addition to a change in flow from the sun to the earth, it is also possible to explain changes in the atmosphere by a change in flow into and out of the oceans or a change in heat distribution by the oceans as well as changes in heat flows into and out of the earth’s crust.