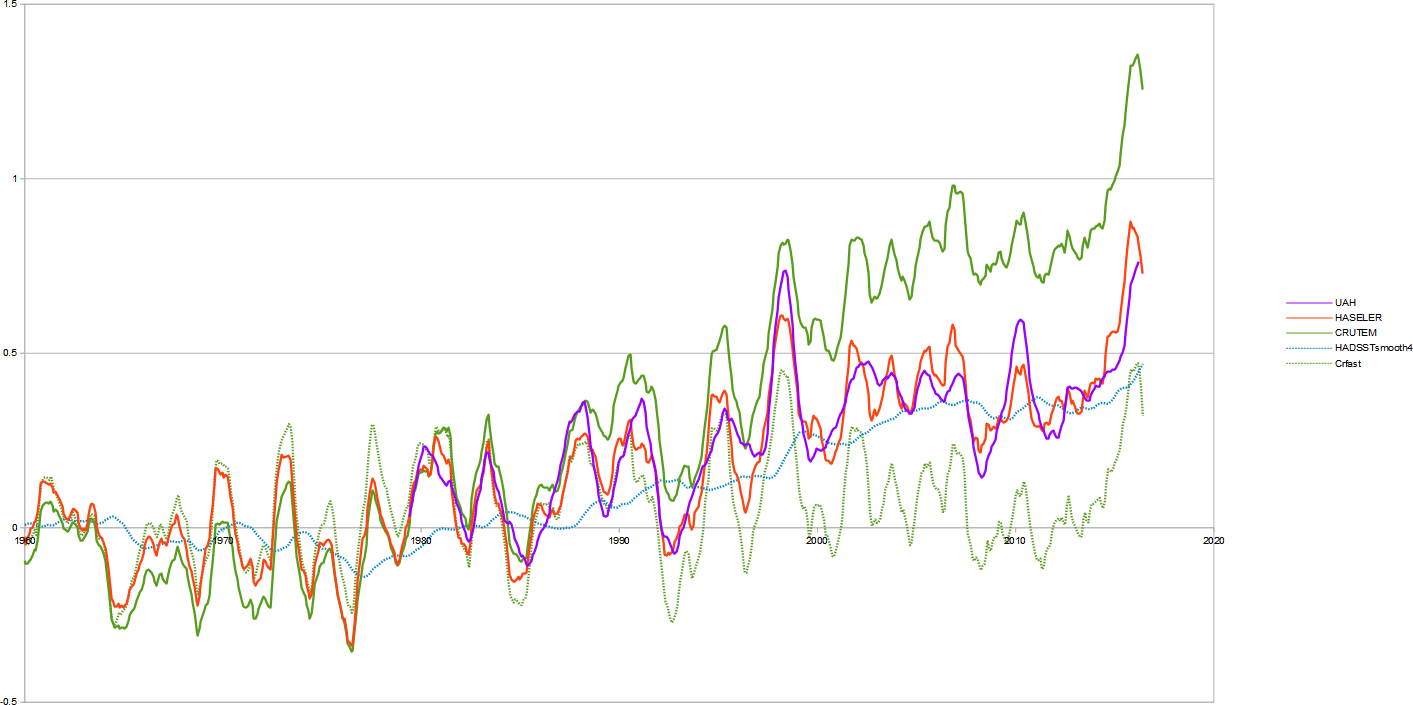
Yesterday I had a look at meteorological balloon data
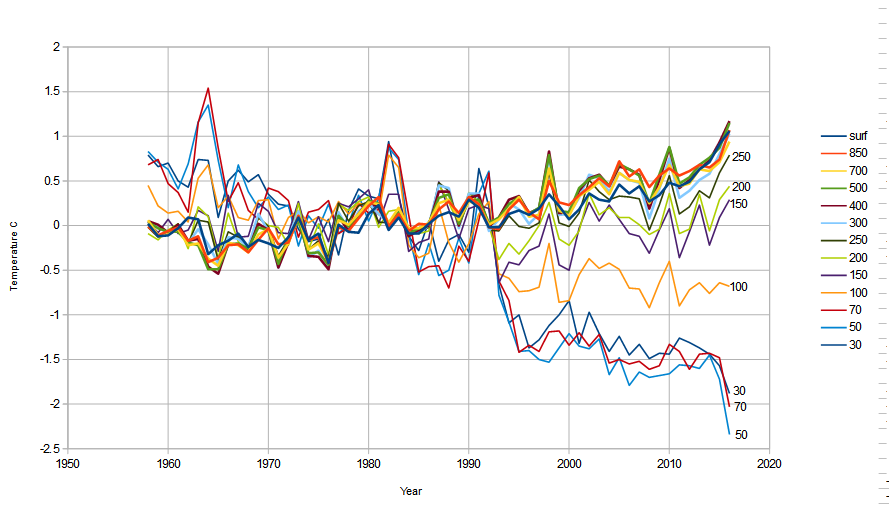 and found that if we plot the trend as shown,
  below 10km (200mb) the atmosphere was warming and above it, it has been cooling and that this cooling reached a minimum at around 50mb (20km). At this point I rather cocked up on my explanation of what was happening in the atmosphere. So I’ll go back over it with some actual calculated changes rather than trying to work it out in my head.
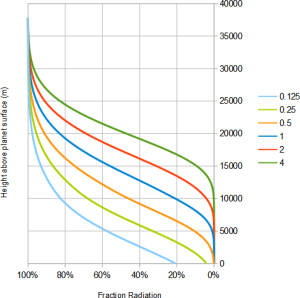
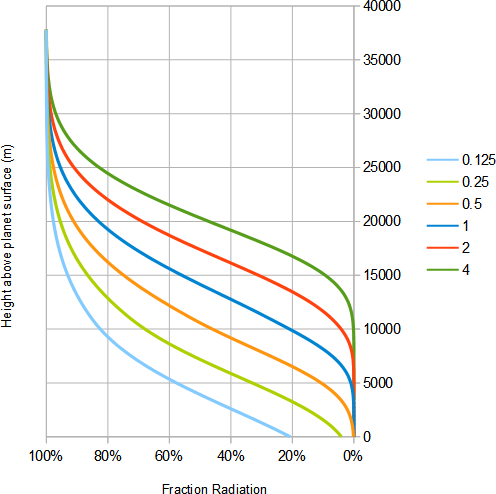
We can think of the atmosphere as emitting radiation to space as shown below. We start at the top of the atmosphere where we naturally have 100% of the emitted radiation. As we go down through the atmospheric layers emitting radiation the percentage falls from 100% at the top downward depending on the proportion of greenhouse gases. And as we can see as we double or halve these percentages we in effect raise or lower the curve.
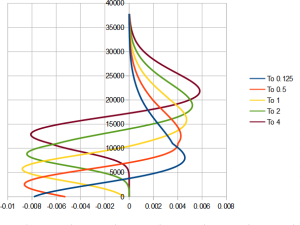
However, what matters for us here is not what happens to this curve, but the change in radiation from any layer. The amount any layer/height emits is inversely proportional to the gradient of the curve. This is shown below for selected curves from that above to show what happens.
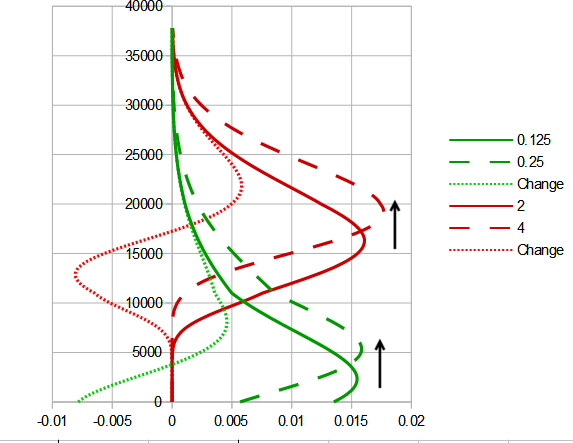
Starting with a a percentage where almost all emission occur from the atmosphere (red). If we increase the gas concentration (2 → 4) the change in emissions with height is the red dotted curve. There’s no change at ground level, then as we rise we reach a region when the lower curve is emitting most so there is a drop in emission. Then we change to a region where the raised curve is emitting most and there is an increase in emissions. Finally when we rise up far enough, there’s too little greenhouse gas to cause any emissions.
The situation is similar with a curve where some radiation come from the ground except the lower part is cut off (and obviously there’d be a dramatic change at ground level).
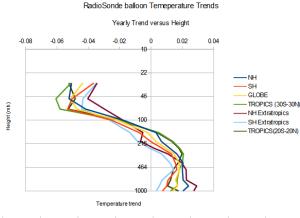
If we now compare this curve with the balloon data we find:
 |
 |
The left curve changes from warming in the lower atmosphere to cooling at 200mb or 10k. On the arbitrary scale of quantity of greenhouse gases, the curve marked “1” changes from cooling to warming at 10km. However it peaks at 15km whereas the balloon data seems to peak at 50mb (20km). Also the right have “1” curve shows no net change of temperature at ground level whereas the curve on the left shows increased warming right to the ground and in the northern hemisphere (which is filled with land) the warming increases down to the ground. This is not compatible with a greenhouse gas. It seems more compatible with IR in a radiation window being blocked by a layer as it would by contrails.
Heatflows
However … what I cannot factor in is heat flows. The lower troposphere is continually overturning and heat moves throughout this region easily. The average depths of the troposphere are 20 km (50mb) in the tropics, 17 km (90mb) in the mid latitudes, and 7 km (400mb) in the polar regions in winter. The balloon data shows the equatorial change of sign occurs at 140mb (14km) the northern extra-equatorial at 240mb (10.5km) and souther extra-equatorial at 255mb (10.1km)
In other words, the temperature warming appears to be correlated with the troposphere and the cooling with the stratosphere.
As the sharp change occurs where the atmosphere changes characteristics and also where aeroplanes fly leaving con trails and also it is an important boundary layer between heat in the bottom of the atmosphere and top – so any change in atmospheric flows could change the heat, I’m now less certain as to what may be causing it.
The heat rabbit from the hat
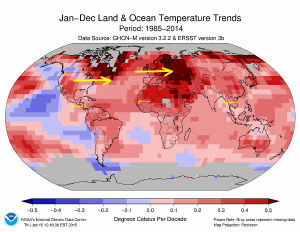
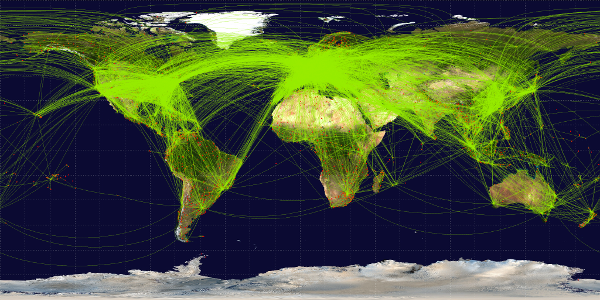
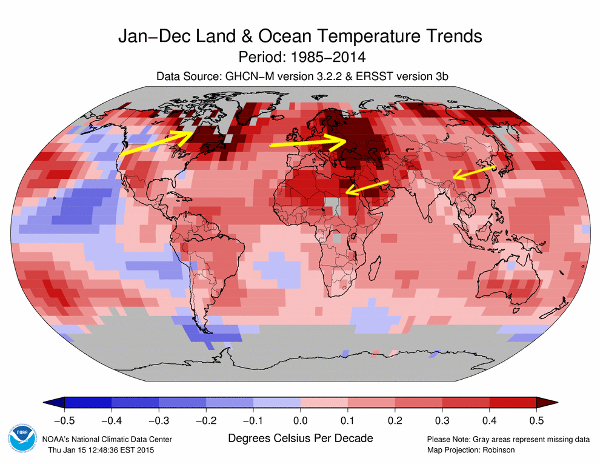
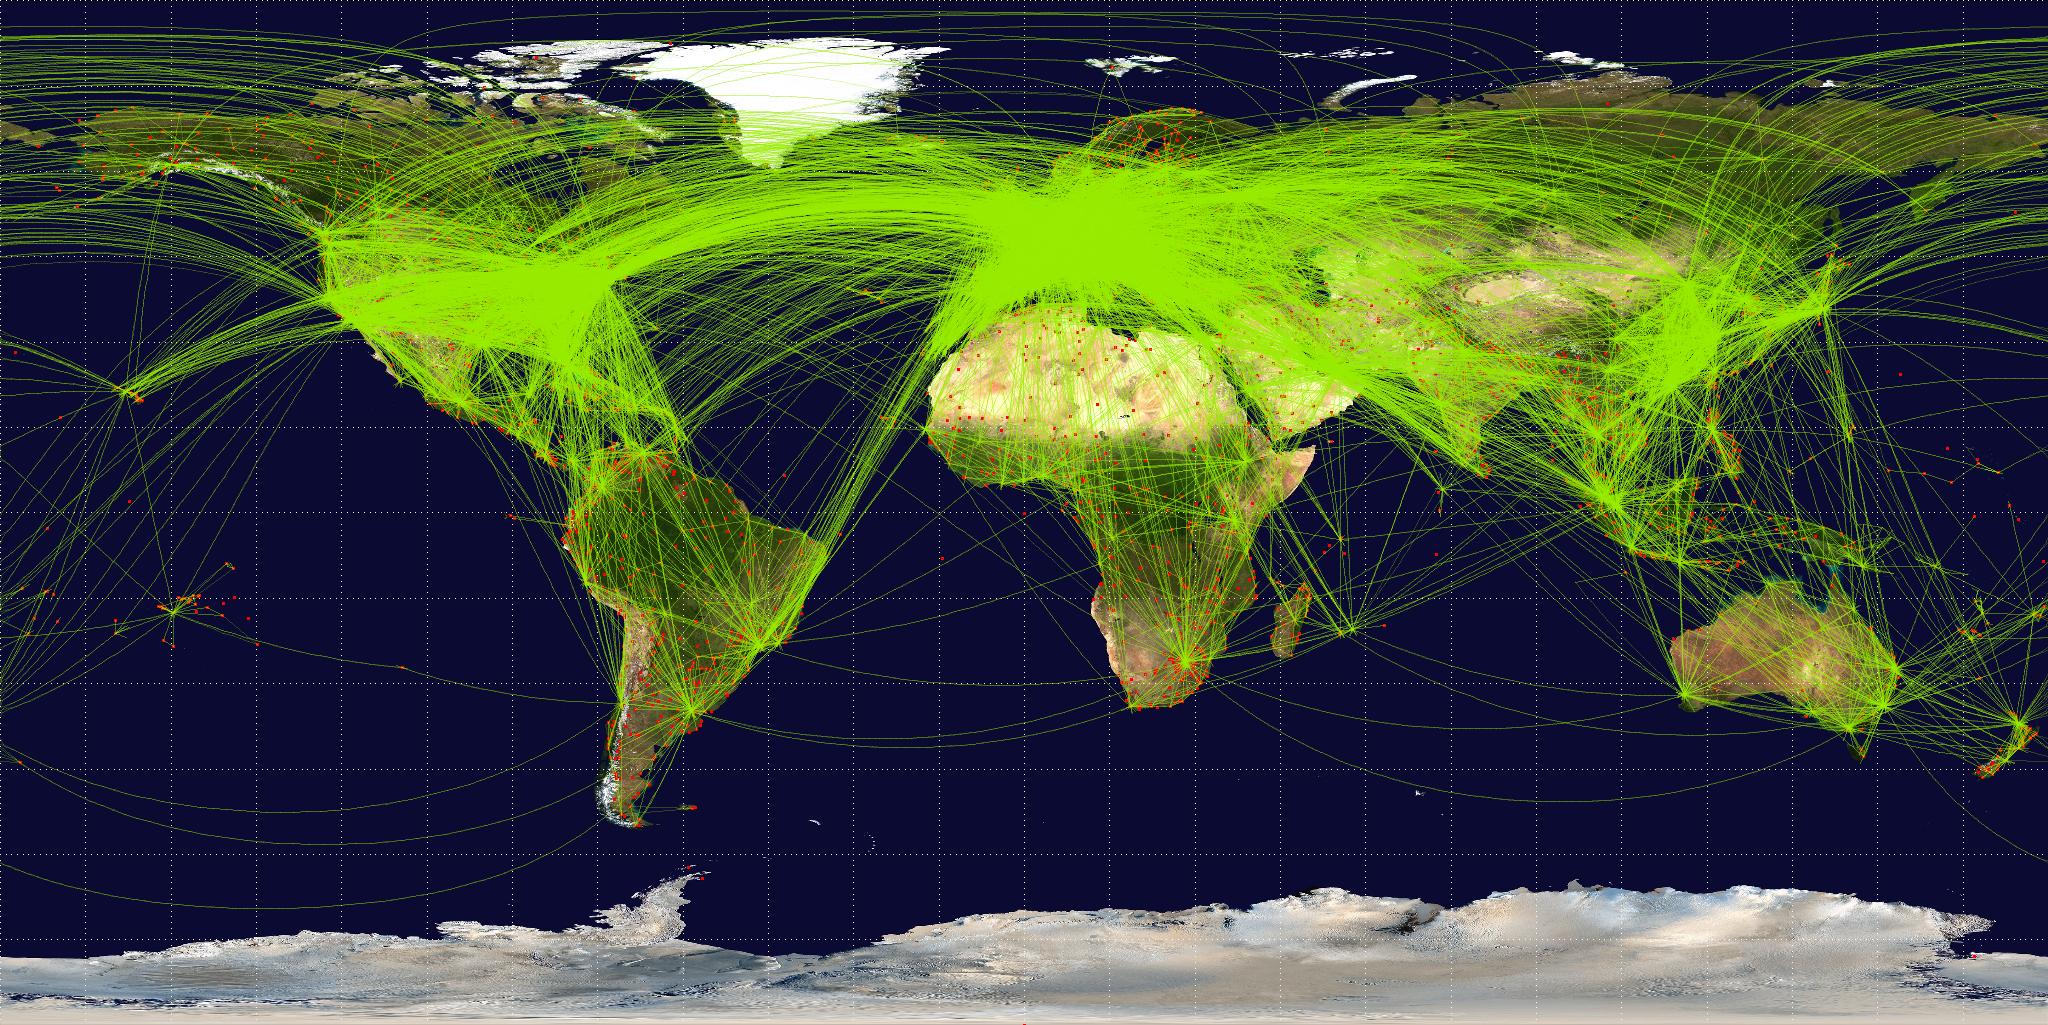
This graphic shows the aeroplane routes. Now compare it with a map of long term warming trend from 1985:

Warming trend 1985-2014
Areas with large concentrations of aeroplane routes seem to be close to areas that have warmed most. But now if I add in trade wind vectors:

Warming trend 1985-2014 showing selected trade winds
I get very good correlation between the most dense areas of aeroplanes routes (N.America and Europe) and the areas of warming are downwind of the trade winds. Which seems like fairly conclusive proof that aeroplane contrails did it. Until I show the stratospheric winds which is what would push contrails along …
Warming trend 1985-2014 showing selected stratospheric winds
Now the N.American hot spot is too far north. This suggests that the main culprit is being driven along by lower atmospheric winds. Now we are looking for something that affects the lower atmosphere. Something showing dramatic changes since 1970 …
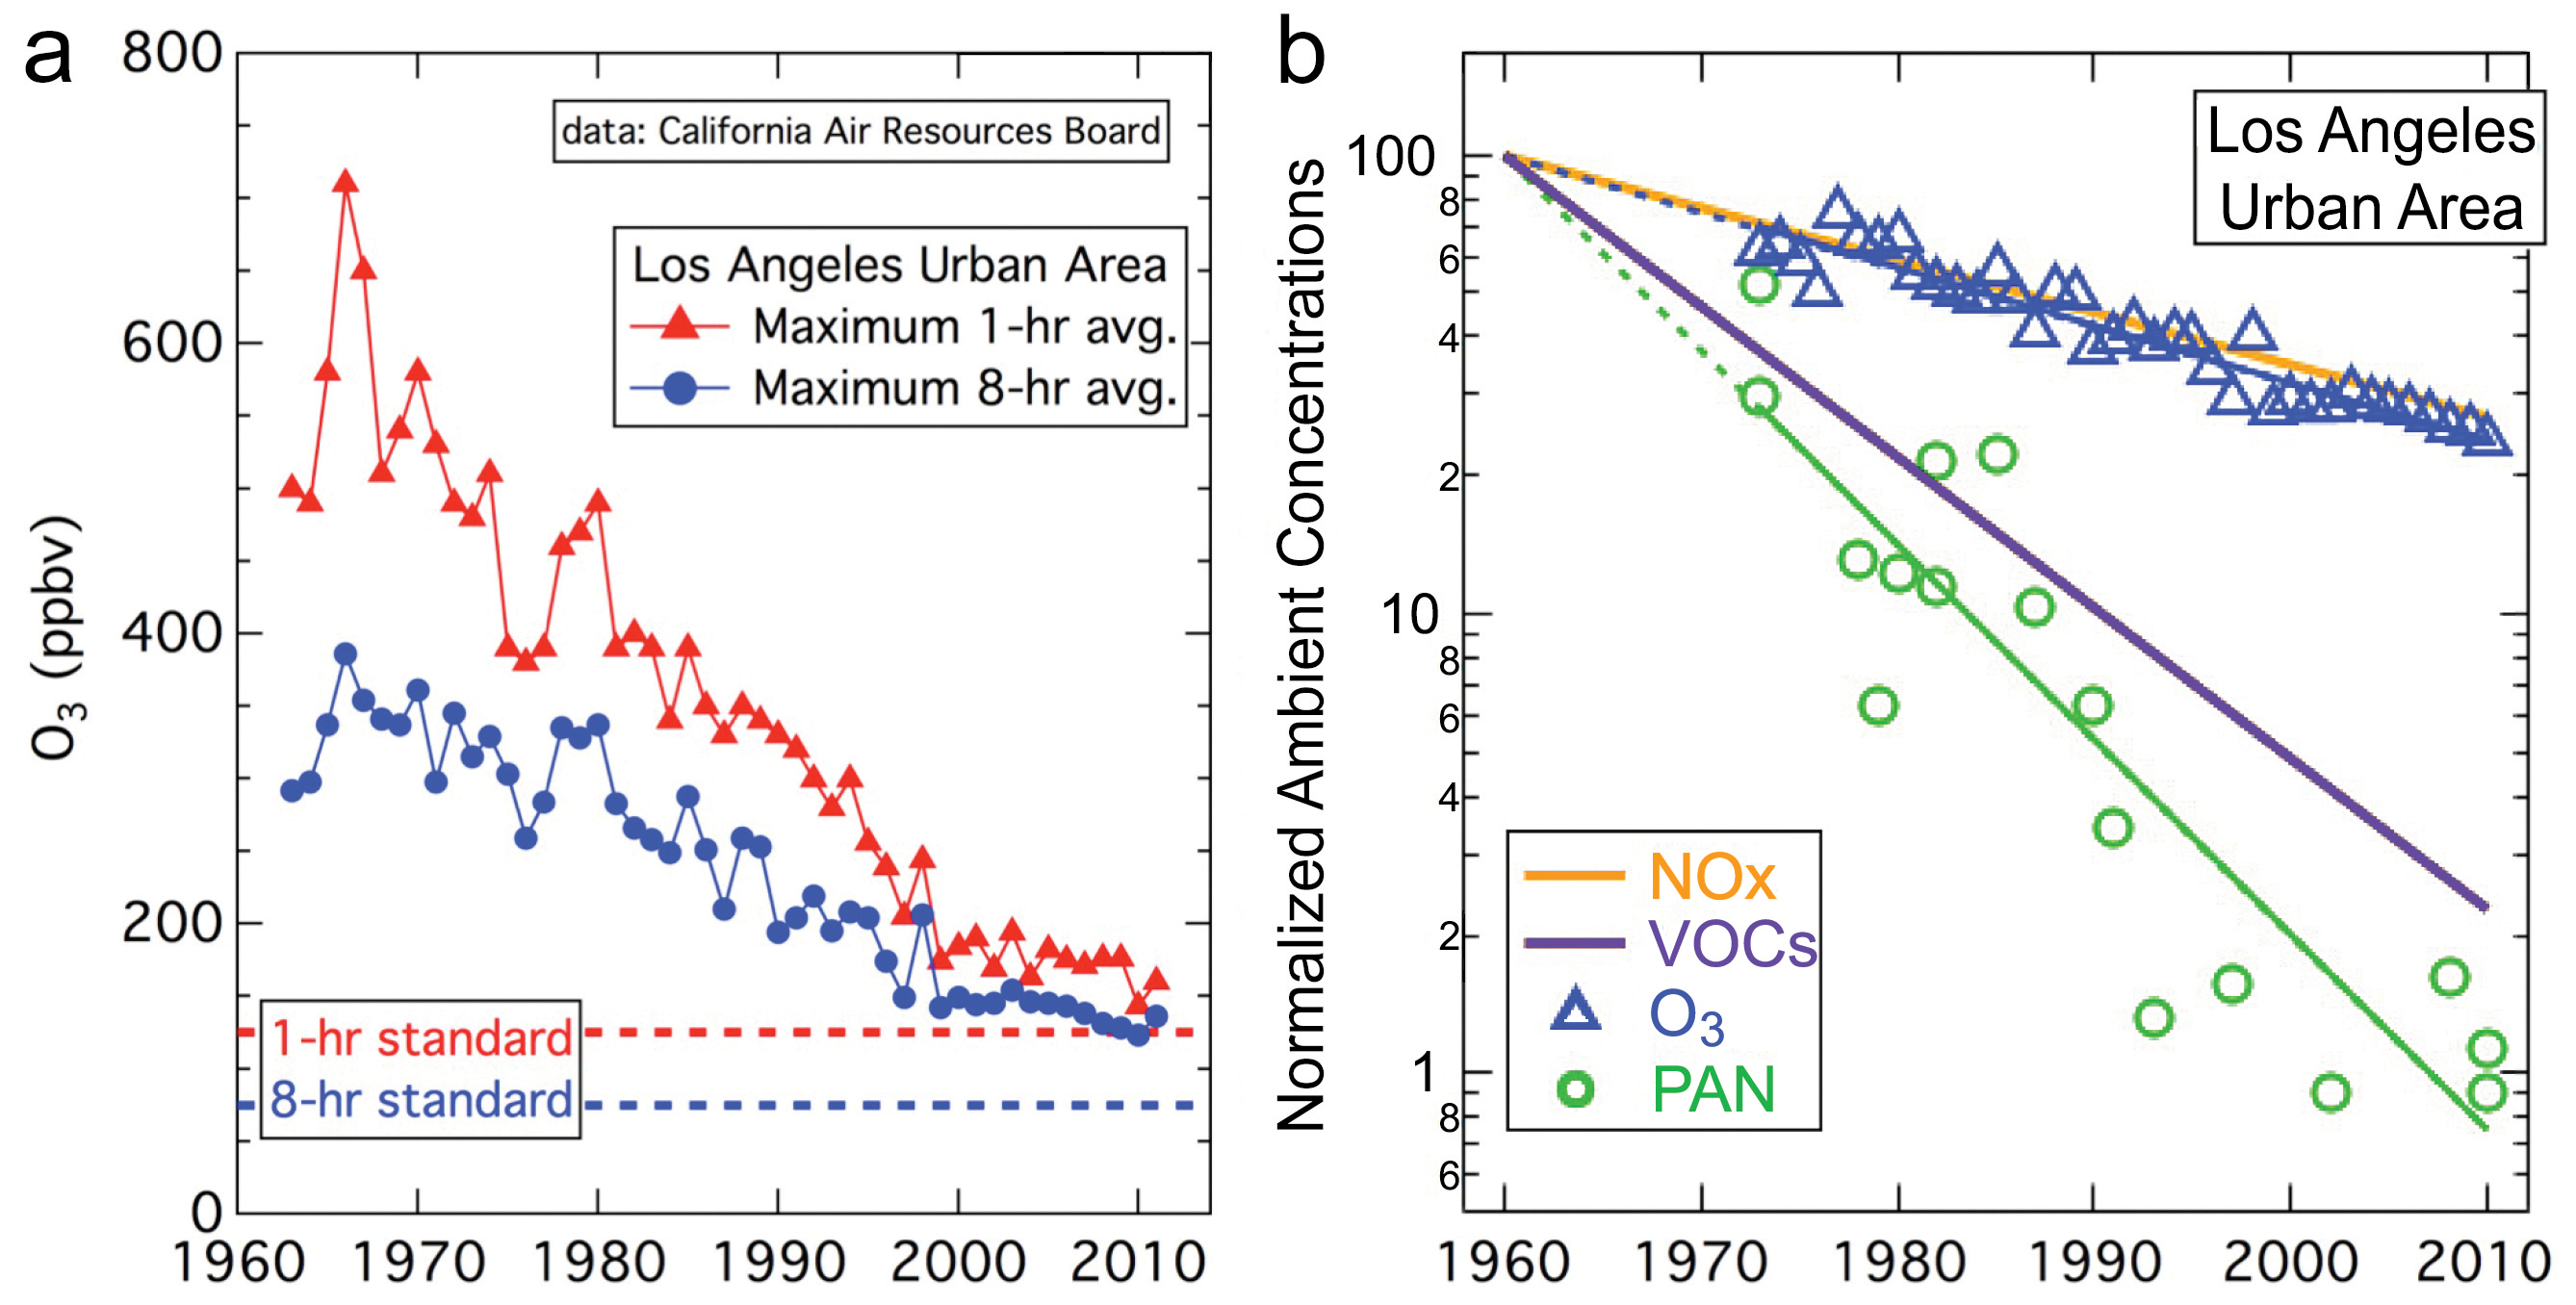
And there has been a massive change in the lower atmosphere … because since the 1970s we have had clean air regulations that massively reduced pollution. However … there is only so much pollution that can be removed from the atmosphere. And as we see in the graph above, pollution was reduced steadily when it was high, but lately since 2000 the change has been lower. And when did “the pause” start … ~1998. However, if we look at the meteorological balloon data, we find no obvious change in trend. However, whilst N.America and Europe have been reducing pollution, places like China have been increasing.
And of course one of the 50 excuses for the pause was:
WASHINGTON – Scientists have come up with a possible explanation for why the rise in Earth’s temperature paused for a bit during the 2000s, one of the hottest decades on record. The answer seems counter intuitive. It’s all that sulfur pollution in the air from China’s massive coal-burning, according to a new study.
And if Pollution can halt warming since 2000, then the reduction in pollution since the clean air acts of the 1970s can cause it.
Discussion
I now have several possible contenders for the oddities in global temperatures:
- CO2 – which is a relatively small effect
- Contrails – which have certainly grown since the 1970s as we need, and affect the atmosphere at 10km which is where we see the change from a warming to cooling trend – but there’s a discrepancy in that the hot spot that seems to be associated with the US is not down wind at the contrail height.
- Reduction in pollution, which has certainly massively decreased since the clean air acts of the 1970s – this change has been largest in N.America and Europe (where we get the big hotspots in the trend) and they are downwind at lower level wind directions.
- Natural variability – we must not forget, that the scale of natural variation is enough to explain all changes we see. Indeed, the changes in temperature are so slight that anything and everything we see could just be a random occurrence.
The important thing here is that because pollution and contrails are relatively short lived things, there effect tends to be strongest just at, or downwind of the source. And this is different from CO2 which is much longer lived. As such we ought to see characteristic trends associated with specific areas. If the cause of warming is pollution, we ought to see strong cooling downwind from Chinese industrial areas as pollution increased. And we also ought to see strong warming downwind of N.America and European polluters and they reduced pollution. Likewise, with contrails, we ought to be pick up patterns, but in slightly different areas particularly in transcontinental flight routes. So the pattern of warming should be different enough to identify the likely culprit.
CO2 warming
However even with CO2, we know where man-made emission are coming from as shown in the map below: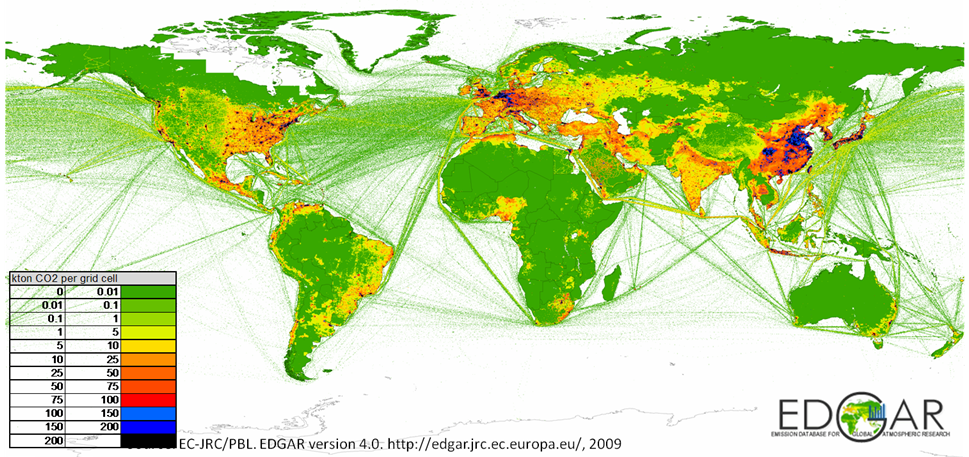 Naively I thought the areas with the highest CO2 would naturally be the areas with high human emissions. But if we look to see which areas are relatively high or low in CO2 as shown below:
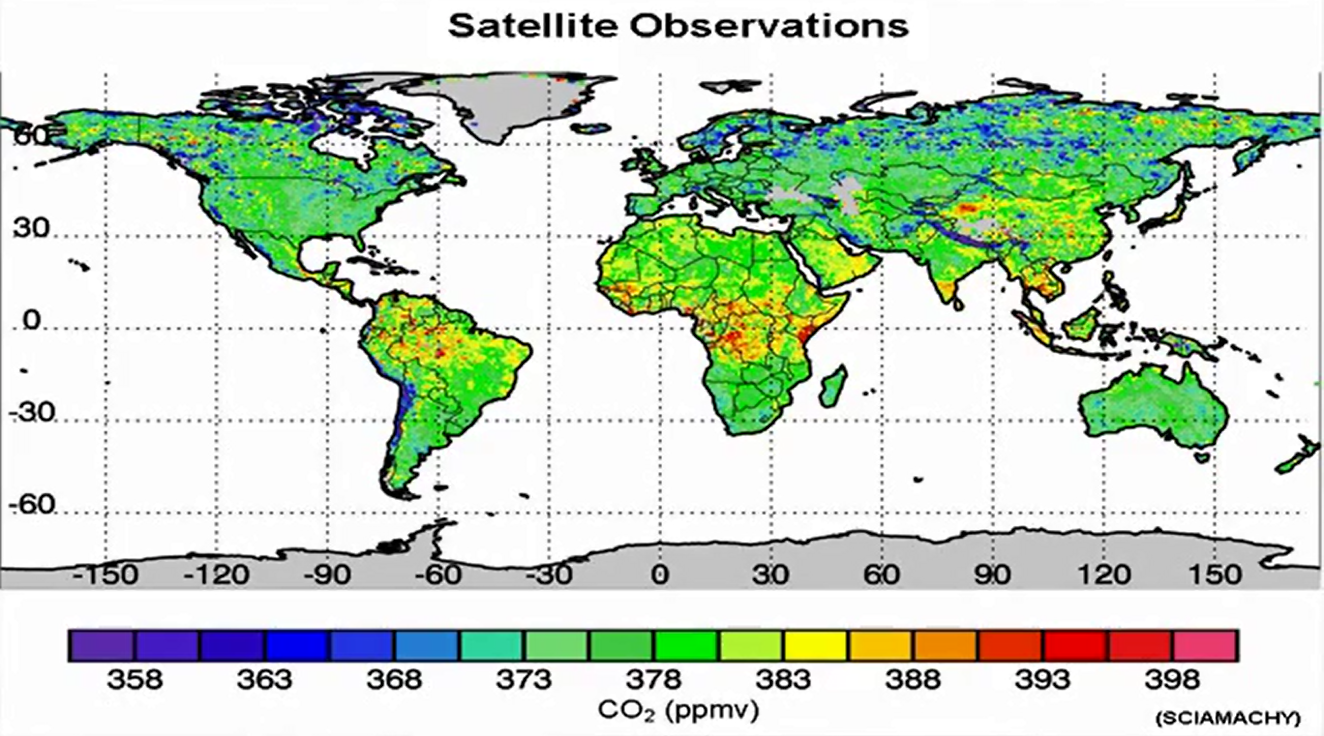
We see that the areas that “lead the pack” in terms of CO2 are central Africa. This suggests these are CO2 sources and those lagging are the northern tundra areas of Alaska and Siberia which are either least emitting or absorbing CO2. If CO2 were having a regional impact, this is the type of patter we would expect, which is very different from the regional hotspots we actually see. However, in defence of the CO2 hypothesis, it is well mixed and we probably shouldn’t expect to be able to discern any regional effects.


