
Categories
-

Archives
- September 2026
- August 2026
- July 2026
- June 2026
- May 2026
- April 2026
- March 2026
- February 2026
- January 2026
- December 2025
- November 2025
- October 2025
- September 2025
- August 2025
- July 2025
- June 2025
- May 2025
- April 2025
- March 2025
- February 2025
- January 2025
- December 2024
- November 2024
- October 2024
- September 2024
- August 2024
- July 2024
- June 2024
- May 2024
- April 2024
- March 2024
- February 2024
- January 2024
- December 2023
- November 2023
- October 2023
- August 2023
- June 2023
- April 2023
- March 2023
- February 2023
- January 2023
- December 2022
- November 2022
- October 2022
- September 2022
- August 2022
- July 2022
- June 2022
- May 2022
- April 2022
- March 2022
- January 2022
- December 2021
- November 2021
- October 2021
- September 2021
- August 2021
- May 2021
- April 2021
- March 2021
- January 2021
- December 2020
- November 2020
- October 2020
- May 2020
- April 2020
- March 2020
- February 2020
- January 2020
- December 2019
- November 2019
- October 2019
- September 2019
- August 2019
- July 2019
- June 2019
- April 2019
- March 2019
- February 2019
- January 2019
- December 2018
- November 2018
- October 2018
- August 2018
- July 2018
- June 2018
- April 2018
- March 2018
- February 2018
- January 2018
- December 2017
- November 2017
- October 2017
- September 2017
- August 2017
- July 2017
- June 2017
- May 2017
- April 2017
- March 2017
- February 2017
- January 2017
- December 2016
- November 2016
- October 2016
- September 2016
- August 2016
- July 2016
- June 2016
- May 2016
- April 2016
- March 2016
- February 2016
- January 2016
- December 2015
- November 2015
- October 2015
- September 2015
- August 2015
- July 2015
- June 2015
- May 2015
- April 2015
- March 2015
- February 2015
- January 2015
- December 2014
- November 2014
- October 2014
- September 2014
- August 2014
- July 2014
- June 2014
- May 2014
- April 2014
- March 2014
- February 2014
- January 2014
- December 2013
- November 2013
- October 2013
- September 2013
- August 2013
- July 2013
- May 2013
- March 2013
- February 2013
- January 2013
- December 2012
- September 2012
- May 2012
- April 2012
- March 2012
- February 2012
- January 2012
- December 2011
- November 2011
- October 2011
- September 2011
- August 2011
- July 2011
- June 2011
- May 2011
- April 2011
- March 2011
- February 2011
-
Recent Posts
Recent Comments
- The nature of the global warming scam | Scottish Sceptic on Protected: The nature of the global warming scam II
- Pict1 on Protected: Why the password?
- To Read | Scottish Sceptic on Protected: Why the password?
- patrick healy on Protected: Why right wing US republicans secretly support Nut Zero
- John on Michelle Mone
Archives
- September 2026
- August 2026
- July 2026
- June 2026
- May 2026
- April 2026
- March 2026
- February 2026
- January 2026
- December 2025
- November 2025
- October 2025
- September 2025
- August 2025
- July 2025
- June 2025
- May 2025
- April 2025
- March 2025
- February 2025
- January 2025
- December 2024
- November 2024
- October 2024
- September 2024
- August 2024
- July 2024
- June 2024
- May 2024
- April 2024
- March 2024
- February 2024
- January 2024
- December 2023
- November 2023
- October 2023
- August 2023
- June 2023
- April 2023
- March 2023
- February 2023
- January 2023
- December 2022
- November 2022
- October 2022
- September 2022
- August 2022
- July 2022
- June 2022
- May 2022
- April 2022
- March 2022
- January 2022
- December 2021
- November 2021
- October 2021
- September 2021
- August 2021
- May 2021
- April 2021
- March 2021
- January 2021
- December 2020
- November 2020
- October 2020
- May 2020
- April 2020
- March 2020
- February 2020
- January 2020
- December 2019
- November 2019
- October 2019
- September 2019
- August 2019
- July 2019
- June 2019
- April 2019
- March 2019
- February 2019
- January 2019
- December 2018
- November 2018
- October 2018
- August 2018
- July 2018
- June 2018
- April 2018
- March 2018
- February 2018
- January 2018
- December 2017
- November 2017
- October 2017
- September 2017
- August 2017
- July 2017
- June 2017
- May 2017
- April 2017
- March 2017
- February 2017
- January 2017
- December 2016
- November 2016
- October 2016
- September 2016
- August 2016
- July 2016
- June 2016
- May 2016
- April 2016
- March 2016
- February 2016
- January 2016
- December 2015
- November 2015
- October 2015
- September 2015
- August 2015
- July 2015
- June 2015
- May 2015
- April 2015
- March 2015
- February 2015
- January 2015
- December 2014
- November 2014
- October 2014
- September 2014
- August 2014
- July 2014
- June 2014
- May 2014
- April 2014
- March 2014
- February 2014
- January 2014
- December 2013
- November 2013
- October 2013
- September 2013
- August 2013
- July 2013
- May 2013
- March 2013
- February 2013
- January 2013
- December 2012
- September 2012
- May 2012
- April 2012
- March 2012
- February 2012
- January 2012
- December 2011
- November 2011
- October 2011
- September 2011
- August 2011
- July 2011
- June 2011
- May 2011
- April 2011
- March 2011
- February 2011
Categories
- #GE2019
- 1/f
- Academia
- ADE
- Advanced Greenhouse Theory
- bbc
- Caterpillar
- Climate
- Cllimate Cult
- computing
- Coronavirus
- Covid
- Economics
- Enerconics
- Energy
- Environment
- Fails
- FGill
- Funding Imbalance
- General
- Geology
- Goat Toads
- greenblob
- History
- Humour
- Ice age
- internet Revolution
- Kyoto
- Light
- Media
- media
- My Best Articles
- Politics
- Proposals
- Sceptics
- science
- Scotland
- SO2
- Solar
- Survey
- transport
- UK
- Ukraine
- Uncategorized
- Wind
Meta
The Caterpillar Theory and it's use in predicting earthquakes
After the boxing day & Japanese earthquake and Tsunamis are geologists ignoring a vital tool that could be used to help predict earthquakes?
In the last article I provided a quick summary of the Caterpillar theory of plate tectonic movement. Put very simply, this is that warming & cooling over 1000s of years causes the crust to expand and contract. Expansion pushes the crust down at subduction Zones and contraction cause it to shrink causing fissures to form in the mid oceans which are then filled with magma which solidifies.
The result is that when the earth is subject to regular cooling and warming as we have over the 100,000 ice age cycle, this will cause the earth’s crust to move rather in the form of some caterpillars.
However, so far I have just treated the crust as a single entity. In reality, the above “arching” of the back of the caterpillar is very realistic. Because far from the entire crust expanding and contracting, the reality is that the expansion and contraction is greatest near the surface.

Change in crust temperature. Note, this is the change in temperature on top of the ADDITIONAL temperature gradient as we get deeper into the crust.
But there is another curiosity. For simplicity, I’m going to refer here only to the change in temperature due to thermal change at the surface without the general increase we get with depth. So, when I say “cooler”, that is cooler with respect to a nominal very long-term temperature we expect at that depth.
Notice for example, if we pick the yellow line starting at +2C. Here the surface shows less warming due to this cycle than a few hundred meters down. So whereas the surface is beginning to cool, down at 1000m, the crust is still expanding. If we then look at the next green curve. We see that crustal cooling has reached down to around 1.2km. So above 1.2km, the crust is now cooling, but below 1.2km the drop in temperature that occurred has still not penetrated to that depth and it is still responding to the previous cooling of the globe from almost 100,000 years before.
However, if we go even further down into the rock, whilst the amplitude diminishes, we find that whilst the surface is cooling, then lower the rock is warming, if we go further down we find that again the rock is cooling and below that it is warming. So, in effect the temperature of the surface is going down through the crust in waves.
The Caterpillar Theory and Earthquakes
Therefore, one prediction of the caterpillar theory of plate movement is that earthquake zones should be depth related and that the depth of earthquakes should gradually move down into the crust over thousands of years.
Differential thermal expansion
Below is the graphic showing how expansion of the crust leads to earthquakes. What it does not show, is that almost invariably, the rock on either side of the subduction zone will be of different types and therefore expand at different rates.
 Nor does it show how the waves of expansion and cooling will move down into the crust. So, in a real situation with different rock on either side, the situation swill be more like the following:
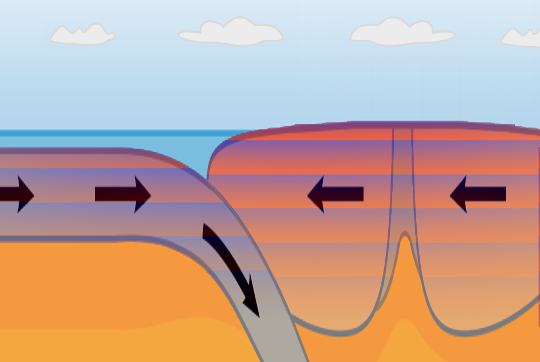
Subduction zone (extended vertical scale) showing waves of ice-age cycles going down into the ground with rocks with different thermal conductivity on each side. (Note in reality the isotherms will be curved near the fault line, but for simplicity this has not been shown).
Now, instead of the rock expanding or contracting uniformly across the fault line with a gradual change with depth. Now, there are a series of pulses of hot and cold going into the ground and along the fault line one side may be cooling whilst the other is warming. Now these zones of stress will move slowly into the ground making it very likely that they will at some point trigger an earthquake.
Posted in Caterpillar, Ice age
2 Comments
Toward a new theory of ice-ages XV (implications)
In this article I want to explore what this new theory implies about the present political debate called “global warming”. Continue reading
Posted in Caterpillar, Ice age
2 Comments
The Caterpillar theory of tectonic plate movement – it's just simple physics.

Thanks Josh cartoonsbyjosh.com

Ice Pressure Ridge
There can be few new ideas which are so simple and so fixed in basic science:
- When solids heat up they expand and push out in all directions
- That material occupies more space in all directions.
- So it expands upwards but also outwards.
- That expanding material must go somewhere.
- So When you have a large sheet of material such as the ice sheet to the right, somewhere the sheet must give. It will either buckle & break forming a pressure ridge as shown, or move out into open water, or one sheet will be pushed over the top of another.
Thermal expansion is just settled science.
But so too is thermal conduction. Solids are also thermal insulators. When we have a thick sheet of material it will take time for any change at one surface to penetrate the sheet. The distance this heat (when applied as sin wave) penetrates a solid is proportional to the square root of the time.
Taking the earth as an example, a 10C change between night and day, penetrates around 20cm. In other words, below 2ocm, the change from day to night will be small. But likewise a similar 10C change from summer to winter won’t be equally noticeable beyond about 4m (0.2m x √365).
And we can work out very approximately how far into the ground the 8C change over the approximately 100,000 years of ice age will penetrate. This we can do by simply extending the change from the surface as follows:
4m x √100,000 = 1.2km
It turns out that the real figure is slightly higher (rock is a better conductor than soil), so the top couple of kilometers of crust will heat up and cool. And therefore it is just straightforward physics that the top layers of the earth will expand and contract as a result of the ice-age cycle.
There is really nothing controversial so far!
If you have 40,000km of crust all pushing outward(1), like the song “there were ten in the bed and the little one said rollover … and one fell out”. Like the ice on the ocean, when the whole of the earth’s crust is expanding outwards, the end of that crust has to go somewhere. There is no open water, so either that thermal expansion will cause pressure ridges, or one layer will slide under another in a process called “subduction” or something else will happen, but …
The crust cannot heat up and do nothing!
So what happens? Recent evidence makes it clear. That evidence is that tectonic plate movement is directly affected by this ice age cycle.

Correlation between oceanic crust formation and ice-age cycle
Continue reading
Posted in Caterpillar, Climate, Ice age, My Best Articles
15 Comments
How to convince a sceptic – just give them the data
Over the years I have constantly heard the view that what climate academics are failing to do is “communicate with sceptics”. This is the biggest load of claptrap I’ve ever heard. It shows those doing this kind of research have no real understanding of sceptics.
The “communication is all that is needed” argument
The logic of this argument is this:
If person A is the authority on a subject and they assert B, then if person C rejects the assertion B, it is either because they have not been able to hear the fact B or they do not know that authority A is the authority.
This is because in social “science” like most arts subjects, most of what is written is mere opinion without many hard facts to back it up. In contrast real science is based on the facts and not opinion. But because social “science” is more an art than a science, when social “scientists” look at climate , they immediately accept that their own colleagues must be right and accept them without question them as the undisputed authority. Therefore when they see sceptics they believe that our rejection of the statements of their authorities must in some way be because the communication of the views of their authorities has not got through for some reason.
The autonomous sceptic
In the previous article I mentioned that I was developing a theory that sceptics tended to be more autonomous and able to think for themselves than alarmists who tend to be group-thinkers who need and value a consensus. Continue reading
Posted in My Best Articles, Survey
16 Comments
A few summary graphics from survey
The last post is a complete report of the full survey results. The following are some of the graphs I started preparing before I realised that it was not a task I could do on my own.
The response to the survey by time
The following graph shows how the total number of survey responses changes with time as a percentage of total reponses to the question do you agree “CO2 will cause catastrophic global warming”. This shows how its announcement of various blogs resulted in “blips”.
Continue reading
Toward a new theory of ice-ages XIV (Putting it all together)
In this final article I try to tie together what I know about the ice-age cycles – and perhaps as relevant, what I do not know. Continue reading
Posted in Caterpillar, Ice age, My Best Articles
4 Comments
Toward a new theory of ice-ages XIII (How cycles are triggered + upper threshold)
Following some very helpful comments to previous articles I am outlining the trigger mechanism in more detail and I want to go back to look at the reasons why we might have a relatively stable inter-glacial temperature.
See also:
- Introduction
- Criteria for Cycles
- Global warming and earthquakes
- Thermal crust expansion, decomposition and the Carbon cycle
- Overview of feedbacks
- Climate stability
- Hitting the buffers
- How CO2 could control climate
- Drying of climate
- 5million years of cycles
- Hadley Cells
- The Haseler Gap
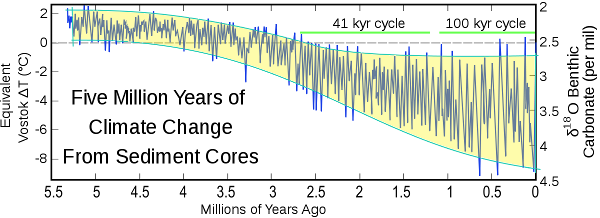
Fig 13.1
The reason I’m raising this again, is because I have not addressed the issue of why the climate might have started to go through ice-age cycles. Above, is the figure showing the progression of global temperature over the last 5million years. What is immediately obvious to me, is that the start of the “41kyr cycle” occurs coincident with the time the upper limit of the global temperature appears to dip below a threshold which is almost never exceeded once the climate is operating in this ice-age cycle.
I have not so far explained why this cycle should have started at this point. But first I would like to explain in more detail why we see the change from ~40k to ~100k year long cycles.
As has been mentioned in several previous articles, these cycles are coincident with changes in the Milankovitch cycle (at 65N). However, the Milankovitch cycle on its own is far too small to cause the ~8C warming we see between the glacial and inter-glacial part of the current ice-age.
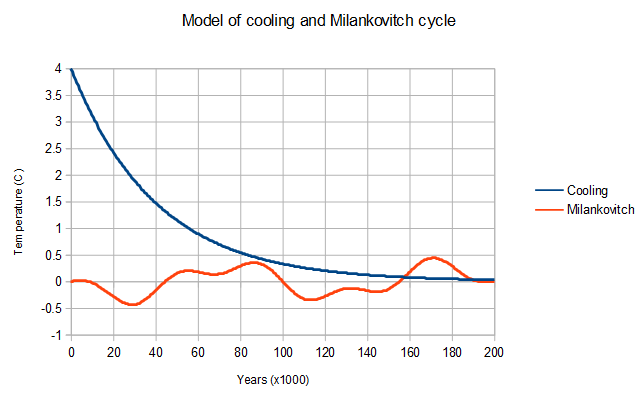
Fig 13.2 Model of exponential crustal cooling (blue) and simplified model of Milankovitch cycle (red)
Model
The model I am proposing is that after the warming as the world enters the inter-glacial, the world then slowly loses the heat as it penetrates the crust and is lost to space so that the crustal temperature tends to follow an exponential decline as showing in figure 13.2.
In addition the insolation (sunshine) onto the earth changes as a result of orbital changes in a regular pattern. I have simulated this pattern by combining a sin waves of periods 40,000 years and 100,000 years.
As stated earlier in Global warming and earthquakes, as the world cools the crust contracts in size and oceanic material is extruded. This process will continue until the crust begins to warm, it then expands and this initiates subduction, various emissions and catastrophic warming.
To show how this process is triggered by the Milankovitch cycle I have created a simple model combining the above exponential cooling with the simulated Milankovitch cycle to show how various scales of cycle and phases of the Cycle can result in a variety of cycle lengths.
4C cooling amplitude
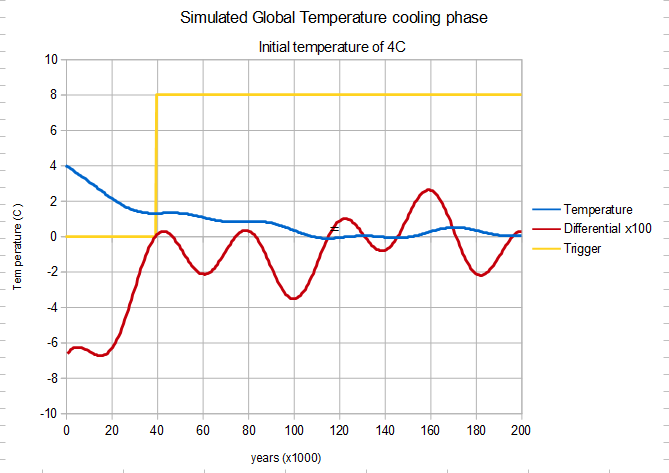
Fig 13.3 Cooling starting from 4C (blue) & differential x100(red)
The above graph shows the modelled global cooling curve (blue) which is the combination of a exponential cooling curve from 4C and a simplified simulated Milankovitch cycle. Below in red is the differential (scaled x100). The cooling curve falls rapidly so that by 40,000 years after the cooling commenced, the rise in the Milankovitch curve is sufficient to overcome the rate of cooling so that we see warming (at some critical point in the crust) which then precipitates a new ice-age cycle.
8C cooling amplitude
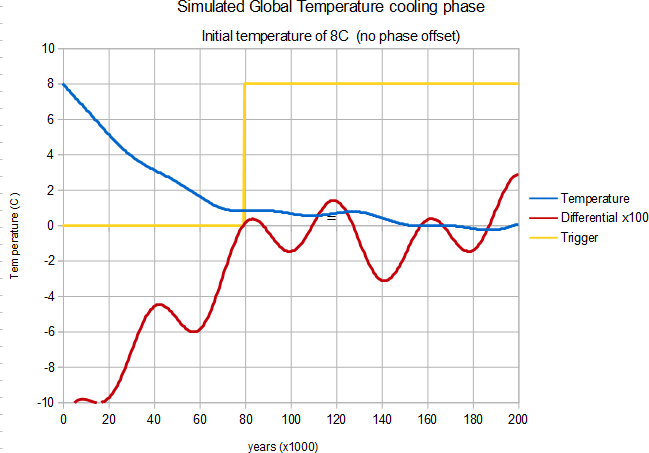
Fig 13.4 Cooling starting from 8C (blue) & differential x100(red)
Above is a new curve showing cooling from 8C. This time the rate of cooling at the 40k Milankovitch peak is too great to overcome the faster rate of cooling and it is not until the 80k peak that the Milankovitch curve can overcome the rate of cooling and so trigger a new period of catastrophic warming.
8C cooling amplitude (change phase relationship between 40k and 100k)
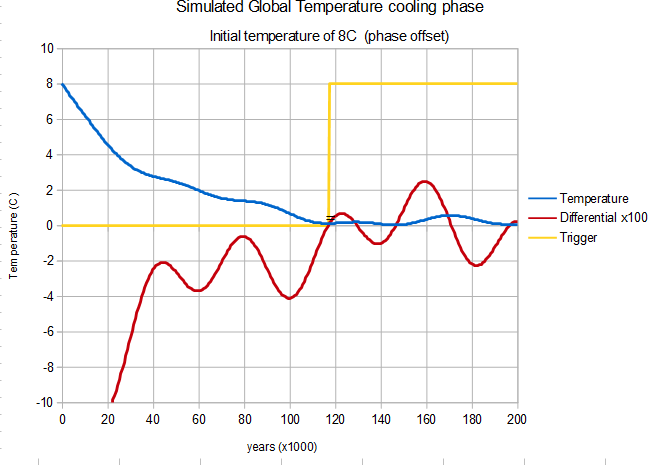
Fig13.5 Cooling starting from 8C (blue) & differential x100(red)
This time with a changed phase relationship between 40k and 100k in simple simulated Milankovitch cycle
Above is a new curve showing cooling from 8C but this time with a changed phase relationship between the 40k and 100k cycle. This simulates the same rate of cooling but at a later/earlier cycle when the change in time has resulted in a change in phase relationship between the 40k and 100k cycles of the simple simulated Milankovitch cycle. This time, because the Milankovitch cycle is smaller at 80k, the rate of cooling at both 40k & 80k is greater than the simulated Milankovitch cycle peak and it is not until the 120k peak that the Milankovitch curve can overcome the rate of cooling and so trigger a new period of catastrophic warming.
Explanation of change from random to 40k to 100k
This model explains why the ice-age cycle changes from 40k to approximately 100k as the size of the cooling cycle increases. This is because when the size of the cycle increase, the rate of cooling is sufficient to increase the the cycle delay from ~40k to around 80-120k years.
It also explain why the cycle is eratic in length and e.g. in fig 10.6 we see what appears to be a repeated change from a series of cycles followed by an irregular one and then another series. This is likely because the various components of the Milankovitch cycle cause the scale of the induced warming to vary so that on some cycles the Milankovitch warming is not sufficient to trigger catastrophic warming.
A likely explanation for the lack of regular cycles before million years is that the overall cooling cycle was too small to prevent Milankovitch or any other natural variation from triggering a new phase of warming. So, almost any natural variation would trigger a new round so causing the “cycle” to be random in nature.
What is causing the change in scale of cooling?
Central to this theory is the concept that the global temperature is triggered into a warming phase and then slowly cools again. The scale of this change appears to be the difference between a lower temperature which is slowly cooling for some reason and an upper temperature which appears to be constant.
Thus is appears that the the climate (before being triggered into warming) is subject to some form of cooling force which is driving the world toward ever colder temperature and presumably at some point in the future, the size of the cooling curve will be so large as to result in even longer ice-age cycles of around 160k years.
However, as I have not looked beyond 5million years, I would not like to say why this is happening. However others have mentioned various possibilities such as narrowing of particular seaways by plate movements, mountain building or even plant evolution resulting is plant species that dramatically reduce overall CO2 levels.
Upper threshold
The upper threshold appears to be an absolute temperature threshold and not relative to the lower temperature limit of the cycle. This suggests that this temperature represents some fundamental temperature change which occurs at this one temperature. Speculatively possible mechanisms are:
- Vegetative growth at a specific latitude
Plant growth is very dependent of ambient temperature. However this temperature varies strongly with latitude. However, if for some reason plant growth at one particular latitude were crucial to global climate and its presence or absence strongly affected global temperature, then it could create an absolute temperature theshold - Ice melt at a specific latitude
Likewise, if melting ice at a specific latitude strongly influenced climate then this could also act as an absolute temperature threshold. Possible example are sea ice in narrow straights which might effectively prevent ocean currents from passing these key points. - A.N.Other key temperature threshold.
For example, whilst it’s just a theoretical example, it is just conceivable that the 3/6 to 1/2 Hadley cell structure tend to occur at a particular temperature.
Evidence which seems to suggest the source comes in various forms
- First, there is the simple fact that we only have around 4 ice-age cycles in the Vostok core. This suggests that there was a massive melting event that finished around 420,000 years ago.
- Next is the apparent loss of ice layers around 240,000 years ago (see figure 1.2 in introduction). This suggests that the cycle is still very close to melting the ice layers at Vostok.
- Finally thanks to the comments so far received, the importance of ice in the “ICE-age” cycle has been highlighted. So whether ice is a cause or symptom, it does seem to play, or is a proxy for something with plays, a pivotal role in some way in the progression of the ice-age cycle.
Alternative and/or complementary Proposal for the upper “Buffer”
Therefore, in the absence of any other plausible or obvious absolute threshold that would cause something specific to happen at the temperature where the ice sheets are melting, I am therefore forced to suggest that the powerful negative feedback / loss of positive feedback is like to be the melting ice-sheets themselves.
Two possibilities spring to mind:
- That the melting ice-sheets directly absorb the heat.
- That is some way the melting of ice, perhaps particularly sea ice, creates a strong form of negative feedback which effectively prevents further warming.
However, what is worrying with scenario (2) is that the upper threshold is not a firm fixed threshold because quite clearly the climate has very often been above this threshold with no obvious limit coming into play.
So, it appears this threshold is itself one that can and does disappear from the system. As such the most likely explanation appears to be (1) above. That physical melting of the ice-sheets absorb heat.
Proposed mechanism
I have so far proposed that cloud formation was a potential mechanism for stopping further warming. However, whilst this may slow done warming, there is no obvious reason why it should create an absolute threshold temperature. Therefore I propose that it only slows down warming, not halts it.
Instead I now propose that the thermal expansion of the crust leads to increased plant growth and consequently to a more humid world. This more humid world has higher levels of water vapour which as a potent greenhouse gas (for more potent than CO2) effectively causes run-away warming.
However, as the warming progresses, these positive feedback effects diminish, but more importantly, the melting of the ice-sheets directly absorb masses of heat energy. This effectively prevents further warming, slowing down the crust expansion and eventually stabilising the crust so that subduction processes massively reduce and with it emissions of water vapour, CO2, SO2, dust and various other things with affect the climate both directly and indirectly.
Thus the melting of the massive ice-sheets which are over a mile thick, which form as far south as Britain, effectively halt further warming sufficiently long to halt crustal expansion. Then various processes start to lock up CO2. Plant growth decreases, the release of water vapour drops and the crust starts to contract reducing still further atmospheric emissions from volcanoes (many of which are plant nutrients).
This then allows the build up of ice-sheets, the globe cools, eventually the amount of CO2 is so low that natural processes cannot effectively lock up the CO2 and reducing atmospheric levels. We reach another near-equilibrium state with very modest cooling, where a small amount of additional warming from the Milankovitch cycle (over a period of time) can start to warm the crust, cause expansion and precipitate us into another warming event into the inter-glacial.
See also:
Posted in Caterpillar, Ice age
Comments Off on Toward a new theory of ice-ages XIII (How cycles are triggered + upper threshold)
Toward a new theory of ice-ages XII (The Haseler Gap)
This is a repeat of the article in which I describe how temperature and CO2 are not correlated around 16,000 years after the inter-glacial peak.
For those not familiar with my sense of humour the “Haseler Gap” also refers to the lack of understanding and disappointment with conventional climate research that I felt when I wrote the article.
See also
- Introduction
- Criteria for Cycles
- Global warming and earthquakes
- Thermal crust expansion, decomposition and the Carbon cycle
- Overview of feedbacks
- Climate stability
- Hitting the buffers
- How CO2 could control climate
- Drying of climate
- 5million years of cycles
- Hadley Cell
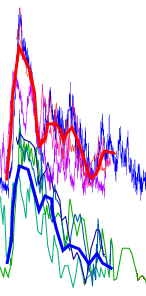
Fig 12.1 Global temperature (top red) and CO2 (bottom blue) from Vostok Ice cores aligned and averaged.
To the right I have my (hurriedly prepared) graph taken from the Vostok ice cores, showing temperature at the top and CO2 at the bottom shown over roughly 100,000 years of the typical (later) ice-age cycles. The problem is that whilst all show a very sharp rise in temperature very closely coinciding with a rise in CO2, temperature after hitting a peak clearly then has a rapid cooling phase which does not occur with CO2. So in the 16,000 years after the peak, we effectively progress more and more into an ice-age (and no, I’ve not worked out whether we are in the phase).
However that temperature drop occurs without an associated drop in CO2. But if CO2 were driving the temperature, then we must see a drop in CO2 associated with the drop in temperature. So, the lack of change in CO2 at a time temperature drops massively (in each of the last four cycles) is unequivocal proof that CO2 “did not do it”. CO2 was not driving the ice-age cycle. Continue reading
Posted in Caterpillar, Ice age
1 Comment