How to survive a Scottish heat wave

I remember holidaying in Shetland and my son complaining about the heat. It was probably no more than 24C, but when you are used to houses heated only to 18C and its a day for stripping off and sun bathing if it ever reaches 20C, 24C is hot.
And as I said in a previous article, we’ve had one of the coldest Junes in 40 years in Scotland. Tomorrow we are told by the BBC-Met Office, that it will reach 27C. So, this is very much from the fridge into the oven with no acclimatisation.
So this is the plan:

  • Ice cubes have gone into the freezer
  • All the windows have been open full since early morning.
  • If the sun breaks through the curtains will be shut (but best to keep the draught)
  • When the outside temperature (currently 16C) goes above the internal temperature (currently 18C), I will shut the windows and shut any curtains I can.

This evening and tomorrow morning (not when we are sleeping) I plan to repeat the exercise, opening the windows wide if the inside temperature is above outside.
This should easily get us through one day of 27C.
But, if this were to continue for a few days (which it does not look like it will), I would continue this exercise until the nights start getting too warm to cool the house, and then in the past living further south, I found the best thing was just to shut any curtains on the sunny side and leave the upstairs windows open as much of the time as I could and doors on the shaded side of the house.

Avoid the chimney effect

But if you want to stay cool (and there’s no point in Scotland getting used to warm!) whatever you do, avoid opening windows and doors on sunny side of the house because of the chimney effect.
This is because the air on the sunny side of a house is in a sun trap between the warm ground and warm wall of the house and so is a lot warmer. If the windows/doors on this side of the house are opened with upstairs ones also open, the house can act like a giant chimney flue, sucking in warm air at ground level and super-heating the house well above the ambient which makes it impossible to sleep at night (particularly in the UK which is relatively humid so that humidity rises substantially at night).

An alternative gullibles strategy

If I were a gullibles activist with a highly paid job telling other people how to cut down carbon emissions, I would not only have the money but be stupid enough to use this strategy:

  1. Turn up the central heating (in Summer!) each day before the heat wave so that you get used to temperatures up to 27C.
  2. When the heat wave comes – enjoy it (probably in your outdoor heated swimming pool with those solar panel ornaments you keep meaning to get working – whilst you heat it with coal powered electricity).
  3. Then when it passes – just keep the central heating turned up – after all you are working in some massive green corps and your massive salary means you are doing a lot to save the planet, so you deserve to be allowed to emit more CO2 than everyone else.

Other Gullibles strategies:

  1. Drive around in your air conditioned 4×4 (which you convinced yourself you need to visit your wind investments).
  2. Buy a big air conditioning unit – and convince yourself that you are someone special that deserves to be cool whilst all the sceptics are boiling in their own heat because of all your good works.
  3. Get an air plane ticket to Greenland to watch those poor polar bears (which you said aren’t there) and see all the ice (that you say melted) and stay in a nice cosy hotel (heated to the same temperature you are escaping and one you claim would be catastrophic for humans).
Posted in Climate | 1 Comment

Greenhouse warming test cases – do you agree?

I came across a couple of articles by Dr Roy Spencer on how greenhouse gases work and was surprised at both his answers and also the multitude of comments. There appears to be many diverse views on the theory, but do these matter in practice? To test this I propose to go through the various extreme cases of atmosphere to see whether others agree with the temperatures I derive. If not I would ask them to explain why they get a different answer.

Roy Spencer’s articles

What first prompted me to write this article is one by Roy Spencer : Why Atmospheric Pressure Cannot Explain the Elevated Surface Temperature of the Earth in which he appears to suggest that adiabatic warming doesn’t affect surface temperature. This is clearly wrong, so I started writing a letter to him to check whether whether I understood him correctly when I found another later article by him: What Causes the Greenhouse Effect? in which he seems to have changed his mind and agree that adiabatic lapse rate does affect surface temperature but now suggested adiabatic lapse is only caused by “greenhouse gases”. This also appears to be wrong, because the lapse rate is mainly a result of the adiabatic law:

P1-γ Tγ = constant

And so long as γ ≠ 1 , temperature will vary with pressure as it expands upwards. However keen observers may be thinking this only applies to a system where no work done. But if air rises it loses potential energy. So, each atom has less energy because it takes energy to raise the mass of the air against gravity. But fortunately, it all seems to work because the work done as the air expands exactly matches the loss in potential energy (however I digress).
So, to check whether there was a real difference in interpreation, I wanted to do is pose a number of hypothetical extreme case atmospheres, and ask whether those like Dr Spencer agree with the values I derive.

Hypothetical atmosphere

I wanted to minimise the complexity of my hypothetical planet to the minimum so that IR emitted from the surface and atmosphere could be treated entirely separately from incoming solar.
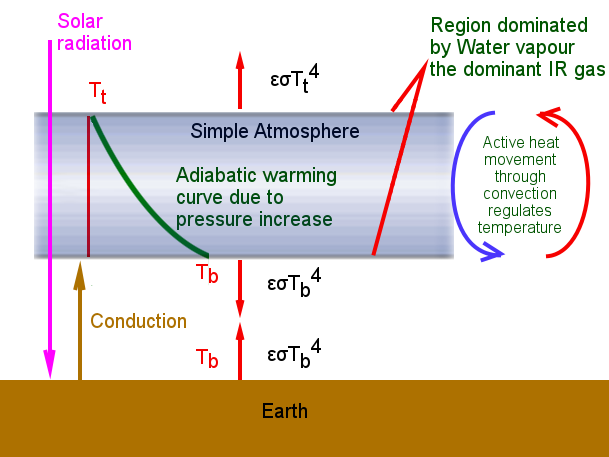
My hypothetical atmosphere based on the following diagram with the one major difference that the adiabatic lapse rate is assumed to be linear with height. Also please note the real atmosphere is in contact with the ground – whereas I drew a gap here so that I could show the various heat flows between the planet surface & atmosphere).

Simplified atmospheric model: transparent to visible, opaque to IR

Simplified atmospheric model: transparent to visible, opaque to IR


Specification of the atmosphere (unless otherwise stated in example): Continue reading →

Posted in Climate | 24 Comments

Evidence global air pressure changes (and causes mass extinctions)

I’ve been looking to find any evidence that might suggest global pressure has changed as suggested by the hypothesis that the end of the ice-age is caused by around a 30% increase in global air pressure (equivalent to an increase in altitude of 3200m) (overview,  calculations).
My first thought was that because birds rely on air to fly, that these would show the largest effect. In fact, I find that many birds can fly as high as Mount Everest, that they are actually better adapted to lower air pressures than mammals. (Which might explain why mountains have so many birds of prey). So far from birds having problems during the ice-age, this suggests that birds would have a physiological advantage over mammals in a lower pressure atmosphere. So we might expect more larger birds – even carnivorous birds.
Then I remember the giant carnivorous birds and wondered if their demise coincided with the end of the ice age. But, there’s no evidence for this as they died out much earlier**
**(but that doesn’t stop the BBC  who have a page suggesting they died out 15,000BC. This contradicts the evidence above and it likely is another symptom of their view that humans are evil. So I guess this is when the area formerly inhabited by this bird had its first humans).
Finally I started a general search for extinction events associated with ice-ages and came to this paper:

“Determinants of loss of mammal species during, the Late Quaternary ‘megafauna’ extinctions” Johnson(2002)

This is an interesting paper, because if you were to read Wikipedia on the “quaternary extinction event”, you will find that the BBC view (i.e. quaternary extinction is another man-made event) is the PC norm. So this paper is clearly sceptical (aka scientific) in nature when it says:

The results of this analysis reject the hypothesis that these extinctions were caused by selective hunting of large-bodied species. Johnson(2002)

Risk of extinction is clearly related to reproductive rate
More importantly, it clearly links these end of ice-age mass extinction event to reproductive rate:

These analyses demonstrate correlations of both body mass and reproductive rate with extinction. However, of these two variables, only reproductive rate is needed to explain the pattern of extinction.

[T]he most striking feature revealed by this analysis is the consistency of the pattern of loss of species in the regions considered. In each case, the majority of species with reproductive rates below one offspring per female per year went extinct, unless they were arboreal or lived in closed habitats. The impact of reproductive rate on risk of extinction was quantitatively alike in different regions and for different groups of mammals, and the power of habitat and arboreality to alleviate that risk was similar. Johnson(2002)

This is so far the only paper with any general observations of how general physiology might relate to end of ice-age extinction so it is very important.
Metabolic rate & air pressure
Because air pressure directly affects the amount of oxygen available and therefore metabolic rate, I would expect those species that were best adapted to a low-pressure regime would be those with the lowest metabolic rate. In other words, in the same environment (so where species are competing head to head and numbers stable) there would be a competitive advantage for species with a higher metabolic rate if air pressure increases and therefore those with a lower metabolic rate would be more likely to become extinct.
This is important, because the end of the ice-age also saw an increase in temperature which in turn led to other changes to the environment and so it is difficult to find anything that specifically relates to pressure which is not also affected by temperature.
But generally if the only change were temperature, we would expect the same environmental niche to tend to move poleward to offset rising temperature as the world warmed. In this way the same environmental niche would have the same species and so they would continue to compete equally with each other albeit in areas further to the poles.
But, if pressure increased by the equivalent of 3200m, then we would expect the same species tending to generally move down hill by 3200m. However, whereas environments can over time move poleward (barring seas) , it is obviously not possible for an environment to move downhill if it is already below 3200m!
So, all animals should be able to cope with a general slow change in temperature with any particular group obviously being favoured. In contrast if pressure changes, then there is a distinct advantage for those with a higher metabolic rate as pressure increases, and those with a lower metabolic rate as pressure decreases.

Is Metabolic rate linked to Reproductive Rate

Johnson(2002) showed that the end of the ice-age extinction event is linked to species with low reproductive rate. But is reproductive rate linked to metabolic rate and therefore oxygen use so that it would be related to atmospheric pressure?
I found a fairly assertive answer to this question in “TOWARD A METABOLIC THEORY OF ECOLOGY” Brown et al 2004

Population dynamics can be complex and unpredictable, but the potential for exponential growth that underlies these fluctuations has been called the one unequivocal law of population ecology (Turchin 2001). The maximal rate of exponential increase, rmax, is predicted to scale according to Eq. 7. This follows from the fact that reproduction is fueled by metabolism,

[Equation 7 B ∝ M^(-0.25)e^(E/kT)]
Where B is population, M is body mass, E/kT is a value of metabolism.
]

Conclusion

This appears to show that it was those animals with the lowest metabolic rate or best adapted to low-oxygen levels which became extinct at the end of the last ice-age. As there is no evidence I know that the level of oxygen changed, this then is strong evidence that those animals that became extinct were those adapted to a low atmospheric pressures and hence that pressure significantly increased at the time of these extinctions.

Sense check

Continue reading →

Posted in Climate | Comments Off on Evidence global air pressure changes (and causes mass extinctions)

Evidence global air pressure varies? – Is this a wheel falling off the caterpillar?

Thanks Josh cartoonsbyjosh.com

Thanks Josh cartoonsbyjosh.com


The main prediction from the caterpillar theory of plate tectonics is that we should see changes in volcanic emissions resulting in changes to the atmosphere such as increasing CO2 & pressure.
The Caterpillar theory is that thermal expansion during the ice-age leads to one plate of the crust being pushed under another. It then cools pulling out from the mid ocean ridges and so tends to move like some caterpillars.
There is strong evidence that the ice-age cycles affect mid oceanic ridge formation and the rise of CO2 as the crust warms is also supportive evidence for this theory (although hardly conclusive as we also expect outgassing).
In my last couple of posts (overview,  calculations), I speculated that global pressure had been changing significantly in recent geological times and that possibly if the air pressure increased by 30% that would be enough on its own to cause the 8C warming we see coming out of an ice age.

How can we prove a change in pressure?

I thought about looking for a correlation with some physiological aspect of bird – because surely they need “thick” air more than any other creature? All I found was that birds fly well above Everest and that there does not appear to be much of a limit in terms of air pressure. That in itself may be evidence that the earth’s pressure has been lower and we now have birds adapted for much lower air pressure – but that is just speculation.
I thought about possible geological signatures from the change in boiling point of water from 100C to around 90C. But there are few places where we see natural boiling water exposed to the air today – so there’s a very slim chance useful changes have been recorded.
Another possibility is that dissolved gas content will change in water. I’ve looked for research into high altitude water to see whether there are any changes which might be recorded in some way – but so far I’ve not found anything.

The evidence I need ??

Continue reading →

Posted in Climate | 3 Comments

More wheels falling off: UK plans to get rid of "gullibles" investment bank

I can’t turn around these days without finding more bad news for the alarmists. This time, the UK government are ditching the so called “Green investment bank” which was another way to pump public money into the pockets of carbon sharks.
This sums it up:

critics have called plans for a sale “reckless”, and said that the move calls into question the government’s commitment to a low carbon economy. (link)

This is all part of the same common sense dismantling of the CO2 scam. Hopefully some gullible-green idiots like the Guardian will put all their money into the bank. That way when it goes belly up they will lose the lot, they will no longer have the massive AUTOMOBILE funded nest egg that allows them live in a cloud cuckoo land. Instead they will have to start writing what the public want to read rather than what they want the public to believe.

Posted in Climate | 2 Comments

Calculation of pressure change need to induce ice-age cycle

In my previous post I suggested that the addition of gases to the atmosphere from volcanic activity could have increased the atmospheric pressure and that would have changed  global temperature giving us the current warm interglacial.
Today I thought it was worth putting some figures on that (thanks to Will Janoschka for the question that prompted it). And here it is: PressureGlobTempI don’t claim to be doing anything other than using the approximation given by Niklov and Zeller 

Ts/Tgb = exp(.233Ps^0.0651 + 0.00154Ps^.385)

Where Ts is surface temperature (C), Tgb is earth’s “grey body temperature” which I treat just as a constant as given in the paper (154.3C), and Ps is surface pressure of around 100,000 pascals.

This suggests that in the ice ages, the 8C lower temperature could be explained by a 30% drop in pressure. That is equivalent today of an altitude rise of 3200m. For us living in Scotland where our highest mountain (Ben Nevis) is around 1300m that sounds high. Continue reading →

Posted in Caterpillar, Climate | 5 Comments

The evolution of the present CO2 desert

After yesterday’s article on the carboniferous desert (350-250million years ago), I’ve added a section to the article suggesting why we had the second drop in CO2 from around 150million years ago to the current “2nd CO2 desert”.
See: http://scottishsceptic.uk/2015/06/25/lignin-and-the-carboniferous-co2-drop/

Posted in Climate | Comments Off on The evolution of the present CO2 desert

Is Scotland experiencing a cooling of the climate?

This May I started checking our beech hedge for signs of it coming into leaf because I had noticed that much of the hedge came out of bud within a day and had recorded the date last year as May 5th. So, I started watching and waiting and a good 12 days later I reached the same stage. At the time I just took it as an example of how variable the climate was.
But last week a journalist friend spontaneously asked me about the colder weather as they had recently run an article saying it was set to be the coldest June in 40 years. I must admit I was stumped to answer. I mentioned that some people were talking about sun spots and this possibly causing cooling, but that was something longer term. However, June continued cold and now it’s well past the summer solstice and we still have not turned off our central heating.
So, I thought I’d try to see if there’s a general explanation for the colder weather.
The best answer to the question I found was this:

“Up till now and really since the beginning of 2015, there’s been a fight between the Azores high and Iceland low. The weather has always been that drier and more settled across the South of the UK while more changeable in the North.” (link) Continue reading →

Posted in Climate | 3 Comments

Lignin and the carboniferous CO2 drop

co2
If one looks at the graph of CO2 over the last 600million years there is a noticeable drop in CO2 levels in the carboniferous – a period when the world experienced it’s first “CO2 desert” with very low levels of CO2.
One possible cause of this massive drop in CO2 and the subsequent deposit of carboniferous rocks is based on the idea that plants developed with a new component in them called Lignin. Lignins are important in the formation of cell walls, especially in wood and bark, because they lend rigidity and do not rot easily.
Lignin is a complex polymer which is indigestible by animals and indeed many bacteria and fungi. Animals can’t digest it because they lack any enzymes that can degrade this complex polymer. But some fungi (such as the Dryad’s saddle) and bacteria can biodegrade lignin using so-called ligninases.
The idea is that some time at the beginning of the carboniferous, plants evolved to produce Lignin. This protected them from fungi, bacteria and animals. Indeed, the theory goes that because they were so well protected even after death, they did not decompose releasing back the CO2 in the atmosphere. Thus plants grew and died but did not decompose so absorbing all available CO2 leaving us in the first “CO2 desert”.
However, it is then postulated that around 100million years later bacteria and/or fungi evolved the ability to produce lignisase to decompose lignin and this then allowed them to release carbon from dead plants back into the atmosphere so raising the CO2 level.

The Evolution of the second CO2 desert (150millions ago to present)

PetterT asked a very good question which is why did we get the second CO2 desert ending up in the low CO2 levels of the present era. I had wondered that myself as I wrote the article, and whilst I had a few hunches it was just speculation. But as I wrote my reply I found that one possibility matches the dates so well that I decided to include it in the article.
A very good question … Fundamentally the level of CO2 is a balance between emissions and absorptions. So there are two possible groups of explanations:

  1. Emissions of CO2 are declining – and fundamentally that means geological processes – so that probably means the earth’s volcanic emissions are reducing. That is not impossible, but it doesn’t seem likely that we would suddenly get a steep decline in the last 150 million years**. Another geological process is the decline in erosion and then decomposition of carbon rich rocks.
  2. The other scenario is that something has changed in the way CO2 is being absorbed. And here there are two ways this could drag down the level:

2a) More Locked up: That the CO2 is being locked up by some process. If it were geological – it should have occurred relatively steadily over the entire geological record**. So a more likely explanation appears to be that we’ve seen some kind of biological evolution which is locking up carbon in some way. I don’t know of any such process and given the amount of carbon it seems incredible that so much carbon could be locked up somewhere without us finding it and trying to utilise it. So, it would have to be something like peat or mud shales or some recent geological formations rich in carbon. Perhaps something in the deep oceans?

2b) More “suck” from plants: That a group of plants evolved that could “hoover up” the atmosphere even at very low concentrations. In effect “CO2 desert” plants have evolved specially to thrive at very low levels of CO2. So, it may not be that any more CO2 is being locked up, it is just that these plants grow until there is virtually no CO2 present in the atmosphere.

**If geological processes are involved, then it would need to be something that “happened” and then continued. I’m not suggesting it, but perhaps if something resulted from two plates colliding then this “thing” might explain the second CO2 desert.
A strong candidate for this would be any group of plants that came to be dominant in the last 150 million years. And so the strongest candidate are the flowering plants or angiosperms for which the earliest fossil evidence (Archaefructus liaoningensis) dates to just 125 million years ago, but reading this they say their research indicates that the origin of the crown group of extant angiosperms is Early to Middle Jurassic (179-158 Myr), and the origin of eudicots is resolved as Late Jurassic to mid Cretaceous (147-131 Myr).
Angiosperms are so common it’s easier to mention the commons plants that are not in this group: algae, mosses, conifers, liverworts, lichen(+), ferns. So, everything we commonly think of as a “plant” with the exception of conifers and ferns. It’s also worth mentioning that conifers evolved 300million years in the middle of the first CO2 desert – so they are probably adapted to CO2 desert conditions!
(+) I included lichen as it is so common – but it’s a combination of an algae and fungus so as far as CO2 absorption is concerned it fits with the Algae).
This suggests to me that the evolution of lignin, led to the first CO2 desert encouraging the evolution of the ancestors of flowering plants (and conifers). These started gaining a foothold as they were better adapted to the CO2 desert conditions. Then when bioforms started producing ligninases, we get a relative CO2 flood. But the flowering plants (& conifers) went on to out compete almost all other plant forms except in specialised environmental niches and slowly over the next 150 million years they take over and gradually suck the atmosphere dry of CO2.

Posted in Climate | 4 Comments

Josh Cartoon: I see no Caterpillar

I’ve been struggling to get facebook to show Josh’s wonderful cartoon which I published in More Caterpillars: The Leaky Atmosphere Hypothesis – is global pressure a proxy for global temperature? Hope this works!

Thanks Josh cartoonsbyjosh.com

Thanks Josh cartoonsbyjosh.com

Posted in Caterpillar | Comments Off on Josh Cartoon: I see no Caterpillar