Those approving wind lunacy to face personal liability

I’m sure that sooner or later the legal profession is going to realise that with some $trillion in value being made from this scam – that there’s an awful lot of ways they can make a huge amount of money by arguing for the “rights” and “compensations” deserved by all the many groups and companies involved.
And because it was just one enormous “snouts in the trough” rush to make money, not many cared or even knew about the massive personal liability that they have taken on. There was not careful consideration of the risks they took on – most had no idea of their own personal liability.
For example, Phil Jones – who was ruled to have broken the law in Climategate – has been personally vouching that we can all rely on him (the bloke who can’t use excel) and that based on his many years of perfect forecasting (none) that we should all spend billions on bird killers & other environmental destroyers – when even a casual look at the figures will see would be far far far far far far better spent on hospitals or other facilities EVEN IF EVERYTHING HE WAS RESPONSIBLE FOR WAS RIGHT (which it is not – kids won’t know what snow is …).
So, the last and perhaps the most ugly and vicious phase of this scam was always likely to involved the lawyers (the copy-n-paste media no longer having the balls to do investigative reporting).
And now it seems that dam has burst:

Germany: City Council Members Approving Wind Parks May Face Personal Liability For Damage To Health!

The legal winds are shifting! Many city councils and wind park planners are going to have to clean up their acts when pushing their pet wind park projects.

Germany’s Fundamental Law specifically expresses that the State is obligated to protect the life and physical body of the individual, foremost from illegal attacks by others.

Consequently, according to German legal experts Prof. Michael Elicker and Andreas Langenbahn here, city councils approving the installation of wind parks may be held personally liable to damage to health of persons who live close to them.
– See more at: http://notrickszone.com/2016/02/08/germany-city-council-members-approving-wind-parks-may-face-personal-liability-for-damage-to-health/#sthash.gDcwHFbs.dpuf

The significance is not this individual case – it is that it marks a change in the attitude of the legal profession. And those are the ones the scamsters really need to fear!
How to put this … let me put it this way: every engineer knows it is relatively easy to defend your calculations when the proverbial bridge is standing. But what is difficult is to defend your calculations when the bridge has not only fallen down – but someone has died – and some corrupt material supplier is now hiring a very expensive lawyer to pin the blame on you – and all you have left in your defence is your hastily prepared calculations written a decade ago before you even knew it was going to be built.
Likewise, it was all too easy for Phil Jones to claim the world was falling apart when he had fooled himself – and could still count of the support of every other academic to back him in saying that … by a bit of bad data that the world was falling apart. What however isn’t going to look quite so compelling in court, is defending statements that the world is going to fall and a lot of people MUST put a LOT OF MONEY into projects based on his “expertise” … when the world clearly did not fall apart, when his predictions look totally stupid if not corrupt … when he has refused to come clean, when he personally has made a lot of money off the scam … it doesn’t take a very good lawyer to spin that into a very nasty perhaps even politically inspired fraud.
This is why I keep saying academics are like lambs being taken to the slaughter – and it is why most sceptics are engineers. Because no engineer ever says “the bridge will stand up” (or to put it in climatic terms – it must fall down). Instead they will only say: based on our calculations assuming the materials are as specified, our best judgement is …”. Caution, Caution — data-defendable caution.
And what do acedemics engage in … crying wolf, time and time and time again and never stopping not even after the evidence clearly contradicts then.
And likewise – just as an engineer needs to be able to defend themselves when the bridge falls down – to put that in a legal context. The law on liability for the penalty for pushing the “global warming scandal” will not be made when everything looks rosy in “Phil Jone’s Garden”. Instead it will be made when the public mood has completely changed, when the evidence is pretty obviously contradicting Phil Jones … at a time no doubt when the public are baying for blood – baying for someone to pay back the billions of wasted money.
And for engineers who are always the first people to blame when something goes wrong – their culture impels to caution as a defence against the inevitable law suits when (usually not for the engineer’s fault) things do go wrong.
But academia is a culture which has no real concept of caution, or quality – where it is believed getting a buddy to give a nod and wink to a paper is all that is needed to make something “true” – where in short they think the worst think that can possibly happen is to have a paper withdrawn and a bit of ribbing from their in-the-same boat colleagues. So, these poor lambs, who haven’t any involvement outside academia – who thought that being an academic made this somehow immune to prosectuation – there will be a very unwelcome shock waiting around the corner in the form of those all too vicious lawyers who will make mince-meat out of them.

The importance of this latest article

OK, this latest article is starting at the edges – it’s changing the perception of liability. but it is a very important event because it shows:

  1. People are seriously beginning to think about suing
  2. That means the tide has turned and people are beginning to believe they can win a court battle for compensation.
  3. It can only get worse – because once one set of lawyers realise that there’s a bountiful harvest in this area of law – the idea will quickly spread.

Now the only questions left are these: how quickly will the lawyer-sharks smell blood? Will they spot the easy prey floundering in the sea and at what point will they move in for the kill? And last but not least – exactly who will they attack – because like this case – it is not necessarily the obvious victims who are the first ones to be attacked – nor in the obvious places.
Posted in Climate | 3 Comments

Long -Term Climate Change: What Is A Reasonable Sample Size?

In WUWT Tim Ball asks a simple question:

Long -Term Climate Change: What Is A Reasonable Sample Size?

And the answer is fairly simple.
For a reasonable degree of certainty (~75% – but see end) One needs around 10x the length of time of data of the length of time in which we are taking a trend – and all the data must be from one homogeneous source. So, e.g. in order to assess whether the last century was abnormal, we need around a millennium of data. In order to assess whether the 1970-2000 warming was abnormal, we must compare the 1970-2000 trend in CET with the last 300-350 years in CET. And the longest period in the raw instrumental dataset of ~160years that can be assessed for abnormality would be around 16years.
So, if you hear anyone say “the pause is ‘abnormal'” – that might supportable (but is not). If however, they say “the last 30 years is abnormal” or even “the last 100 years” – they are either stupid, fraudulent or insane.
However, it all falls apart if we start comparing apples with cheese: tree rings for 1000 years with bogus fraudulent surface data for 30 years. Becasuse, for example, if we look at what kind of change is normal over the last 1000 years in the tree ring data – then we must compare it the same data for the last 100 years. But in contrast – the whole “hide the decline” scandal, was that, not only weren’t they comparing tree ring data with tree rings, but they knew that the tree ring data showed entirely the opposite trend from that they were stating to have been shown to be “abnormal”. With fraudulent behaviour there is no way to make their assertions credible by merely adding to the (bogus) data.
However, as 10x the data is problematic when we need quicker indications, I would suggest that we can get a “more likely than not” indication for 3x the period. But now it is critical that those doing the assessment come from the right background (which means tried-and-tested-engineering and not woolly-pc-panic-stricken-by-any-change academia.
So, e.g. with 160 years of data, we (engineers) can start saying with a modest certainty that if the last 50 years showed warming that had not been seen before in the last 160 years, then something was odd. But, just to show how ridiculous that assertion would be, even using the bogus upjusted data, the 1970-2000 period shows the same warming as 1910-1940. So, there is no indication of any abnormality with the global temperature (despite the known upjusting which in itself tells us just how normal the present period is – that even fraudulent changes can’t change it enough to make it abnormal).

The rational for long periods of data:

Until we know what is normal we cannot know what is abnormal

To take a simple example, we have two flight computers on a space craft – one says “full throttle”, the other “cease throttle”. How do we decide which is correct? The answer is that unless we have additional information there is no way to even guess which is correct.

If however, we have three computers, two say “cease throttle” and one says “full throttle”, then all other things being equal, then if the chance of any computer being wrong is p. Then the chance of two being wrong is p2

So, the chance of two computers being wrong as opposed just one is p2/p. So as p<1, then irrespective of the actual value of p, it’s always more likely than the minority is abnormal.

Likewise, at the very least, we need three centuries/decades of data to even start guessing which decade is “abormal”.

So, why 10x the length of data? The reasons are many:

The rule of 10

In essence, this rule simply means we need an awful lot more data than we think we need by “academic” statistics – because the real world is full of real people who just don’t think in the way needed for “academic” statistics to be valid.
The biggest problem is that we usually start looking at data when something “odd” appears. (Or to put it another way we ignore data where nothing odd appears) And, by pure chance, if we continue to monitor data, for long enough or from enough different sources, sooner of later by pure fluke, we will see an odd “event”.
As such, when we start assessing the risk of something like “climate change” we are not just picking data at random. Instead we have already “cherry picked” a period which appears odd. So, by pure probability, if we monitored 100 metrics, one of of those 100, should have a signal that only occurs 1/100 of the time in that signal. In that case, we would need 100x the data before that 1/100 signal would be within a sample where it was likely to occur. (but even then  another such event should have occurred, so there is twice the probability of this event than would occur by pure chance – just because we only focussed on something that appeared a problem!)

But the untrained human factor gets worse

But, even with simple data, there are so many ways to take the same metric and suggest “abnormality”. Taking temperature, we can for example look for “hottest” and “coldest” (2). Also “faster warming” and “fastest cooling” (2). Then we have the possibilities of turning points(2) and cycles(>2)** – all of which can be construed as “odd”. So, even with simple data, there are around 10 different ways to see something “odd”.
So, quite contrary to what the statistics supposedly suggest, it is actually “normal” to see a 1-in-100 year event in a decade of temperature. It is also normal to see a 1-in-1000 year event in a century of data.  So, if you are just looking for something “odd”, in around 10 different metrics, the chances are you will see a 1-in-millennium “event” every decade!!

The human factor

So, if we are intent on finding something “odd” in even one dataset, the chances are quite high and that is why we need long time series. If however, we have a host of datasets (floods, droughts, snow, temperature, rain, hurricanes, peak-rain, peak-wind, peak, rain, etc. etc.), then if we are allowed to cherry pick as academics have done, then we are guaranteed to find something abnormal.
This is why one needs to be properly trained in engineering practices to do risk assessments. Because the biggest quality failing of risk assessment is the idiot doing the risk assessment – and particularly if they don’t come from a culture used to doing risk assessments and living the with result of either overstating risk or under-stating it.
So, even with the best of intentions, and even with 10x the data of the period being assessed, the best we might say is that there is “more chance than not” of some data being abnormal, if (as has happened) you have politically motivated groups free to scour the data and worse – free to channel resources – with the intention of finding “something wrong”.
If however, you have people trained in risk assessment from a suitable culture, who know the temptation to cherry pick data and have the training, experience AND culture to resist, then the the certainty with 10x data can rise as high as perhaps 90% confidence. (Note the idiots at the IPCC have stated 95% confidence, about a period equivalent to the length of their whole dataset – so whilst they have no idea & no data to say what is normal – they are 95% sure that what they have is abnormal).


**To explain, if we accept a turning point is simply a variant of a sin-wave (with period twice the sample length), then a trend is a variant of a cos-wave. Then a simple cycle (up-down-up-down) is just twice the frequency. However, if the probability of this is half as high (there being twice as much “info”), then if we sum the total series, the probability of the total is around 1. However, because we are looking for things “happening” … we can often accept cycles that only appear later in the data. So, there is quite a high chance of seeing something “odd” in the form of an apparent cycle.

Posted in Climate | Comments Off on Long -Term Climate Change: What Is A Reasonable Sample Size?

Review of possible mechanisms for long-term climate change

Two apparently contradictory headlines caught my attention today:

To which my response was “of course trees cause climate change” – that is to say real climate change (not what the copy-n-paste journalists call “climate change”).
So, I’m going to take the chance to summarise my current thinking about the causes of global climate change. So, I’ll start with my own response to the above article:

“of course trees cause climate change”

Continue reading →

Posted in Climate | 6 Comments

Oh dear! The "science" is settled – so 350 jobs go.

When I joined industry, one of the first things I was told was “always look busy” – because any department that didn’t look busy was bound to be the target of any redundancy.
Obviously climate researchers in Australia never got that advice – because for years they’ve been saying “the science is settled” – which in short means they completely understand the climate and there is no need for the public to pay them to do further research.
We sceptics have frequently been heard to say “if the science is settled why can’t we just get rid of these annoying researchers” … and so it seems that  Malcolm Turnbull the Australian PM has had just the same thought. Now 350 jobs are going with nearly 70% of some departments being booted out.
… and how can they argue … as afterall they’ve been saying (or condoning) the statement that the science is settled … which either means they are lying (and should go) or are really no longer of use (and so should go).
I doubt very many academics will ever again support the view that “the science is settled”. Indeed, I imagine most hearing this news will realise that what happens in Australia could easily happen anywhere else. And so unless they find some uncertainty left to investigate, they too will be out of a job.
My thoughts:

  • We actually need better research on the climate – and if we could have good research and researchers (not eco-idiots pushing their eco-political views dressed up as numbers) then I would argue for more spending.
  • You’ve got to laugh – I think the phrase is “hoisted by their own petard”.
  • There seems to be a bit of a trend to “downsize” climate related work. There’s also growing scepticism. Not sure how much of this is because climate is an easy target – and it’s full of idiots who can be easily cut – and how much is because of growing scepticism – or indeed a combination of easy target and not much interest.
  • Supposedly more effort is being put into “mitigation”. My experience is that the hot heads on climate are in the mitigation side (so no hard science and full of left-leaning eco-fascists who want to dictate to the rest of society the “ZEE MUSTE” do Vat I say. I suspect by “mitigation” what is really meant is “giving engineers money to build flood defences and dams”.
Posted in Climate | 8 Comments

The chances of there not being a climate scare right now!

After my last post, musing that I cannot hope to ever discern the human influence of CO2 on the climate – I started thinking about the chances of such stupid scares occurring by pure chance because the climate always has such trends. My thoughts went thus:
In any civilisation that reaches a stage whereby it starts acquiring global data so that it can measure climate globally, there will be by necessity an enormous number of changes any of which could (by the unscrupulous) be tied to climate. And particularly soot, aerosols, chemicals from industry.
So, whereas the modern world is a lot lot cleaner than a few generations ago, the environmental “consciousness” of a world-wide perspective would mean that groups would use these changes to frighten the public. So, it is almost certain that groups – like academia and fiends of the earth would have been ready to abuse science and jump on any change in climate.
Therefore, what is the probability of such change. Let us suppose the climate has three states: pause, warming, cooling (and remember there are many other naturally changing variables that can be cherry picked!!). At the present time we have around 30 years of satellite record & 50 years of CO2 – or around 3-5 decades of real “data”. Because methods change, it is relatively easy to change the more distant past to re-enforce ideas that things are “changing”. So, what is the chance of seeing “something” in 3-5 decades? Lets use 3 decades:

  • Trend: Full Cooling/warming  = 2/27
  • paused trend: warm/cool – pause – warm/cool 2/27
  • pause going to trend: pause then pause or  warming/cooling then same = 4/27
  • Turning: warming then warming or pause or cooling then cooling = 6/27

So, total ways of getting “scary” change = 14/27
As “scares” always use the last few decades – and as it seems to me only three decades would be enough to convince most people that the “experts” had predicted “the” trend (turning point). It seems that the best estimate of the probability of a climate scare – in the first few periods of measurement – is around 50%.
On average, once this scare becomes engrained, the chance of it continuing is therefore 66% (because as we see, the group-think and associated bandwagon effects diverts funding to the alarmists and diminishes the authority and funding for sceptics). So, on average the probability of the length such scares after they start is:

  1. One decade 33% (leaving 67%)
  2. Two decades 22% (leaving 45%)
  3. Three decades 15% (leaving 30%)
  4. Four decades 10% (leaving 20%)

So, at a rough guess, 50% of societies inventing worldwide measurements will trigger a scare in any one measurement (but there are many such measurements so perhaps the truer figure is closer to 100%). And in general, it is likely that such scares/scams will last around two decades.
In other words, given that the global warming scam is now well on the way out, we are perhaps quite typical – no better – but no worse than would be expected (given the stupidity of academics and others who falsely believe they somehow stop these scares because of their “expertise”).
 

Posted in Climate | 2 Comments

The chances of getting Climate extremists' predicted warming

 
I would just like to share with you a thought. Having calculated that there should have been around 0.6C warming during the pause, I was just musing what the chances of getting this warming be coincidence would be. And I suddenly thought “it warms or cools by about 0.1C per decade by chance … so what is the chance of having 6 decades in a row to get 0.6C? It’s 1/2^6 = 1/128.
But this is the humorous bit – I then realised that in those six decades the target would have risen to 1.8C. So, then I thought “what if I use the higher end of warming we’ve seen of 0.2C …. then I thought what is the maximum multi-decadal warming we’ve seen. It is of course from 1690-1730 in CET when we saw about 0.5C/decade. So, now the chance is that we’ve seen (at least 4) decades of 0.5C warming over 35 decades. So, the chance increases to 4/35 = 11% (however we might expect regional variation to be greater).
So, I think we can safely say the upper chance of the actual temperature (not the fraudulent surface data) showing warming of >0.5C per decade is 10%. As warming is as likely as cooling (give or take a few ice-ages and CO2) the 50% probability is at 0C/decade. And as most years (from 1850 – in what I now know is fraudulent surface data) show around 0.1-0.2C warming or cooling, the 1 standard deviation must be around 0.1-0.2C/decade.
The minimal warming the extremists need is 0.3C (to account for two decades of pause) – but if that occurs in a decade, they will need around 0.45C (as it should have warmed even more). So they actually need >0.45C warming over the next decade.
At a rough guess, based on my figures, I would suggest around a 20% probability of 0.3C warming and nearer 10% of >0.45C of that  minimum warming occurring by pure fluke (with no CO2 involvement).
So, my best estimate is that, by 2025 – there’s only a 10-20% chance that mother nature will give the climate criminals what they need to defend their claptrap.
As for CO2 warming
My best estimate is 0.5C warming for a doubling of CO2 – which will take many decades/centuries to come through. CET shows (suggests?) a 1/10 chance of 2C warming by pure chance. So, even if the REAL climate showed 2C warming in a very specific period of 4 decades, then the best we can say is that we are 90% confident that this short-term rise of 2C is not natural.  But if we extend the period long enough it will always happen by chance – so the confidence falls dramatically over longer periods.
But even the massively adjusted data (so that all warming since 1940 is due to adjustments) only shows 0.8C warming, and not over a short period of a few decades but over the whole century (till the pause). That is the century of a massive change in measurements from manual to automated measurements. Even if we look for the most “obvious” trend in the period 1970-2000 (also the period of most heavy adjustments) it only shows 0.48C warming (which happens to be same as 1910-1940!). As I stated above, based on CET we would expect around 10% of decades to show this warming. So in 150 years we expect around 1-2 decades of 0.5C warming!!!
Even if we now saw two decades of 0.5C warming or cooling – it would just be “normal”!! (although I’d have to recheck the scale of variability between CET and global – all the more difficult when the surface data is fraudulent!)
So, to summarise – I cannot think of any test – when we’ve already seen change, which could demonstrate the minuscule level of CO2 warming “expected” would be man-made. There would need to be more than 1C warming in a few decades (about 2C total warming) to say even with a modest certainty that the signal is human caused and not natural. In contrast, rather than warming we’ve seen “the Pause”. They needed fireworks – they got a cold shower!
Because there is a slight reduction in long term variability, we probably need around 100-1000 years of future data so that the scale of natural variability reduces sufficiently to “prove” any change of 2C was “human causation”.
In other words – unless I am completely wrong and the climate is subject to massive positive feedbacks for warming (so >1C warming in which case I’m probably dreaming this whole world as the world would have burned up yonks ago) … so in any real world (and not fraudulent data), there’s no chance of me ever knowing whether CO2 has had an effect within my lifetime.

Posted in Climate | 1 Comment

Crunch Year for global warming (= the scam)

2016 will undoubtedly be the crunch year for “global warming” – undoubtedly the biggest scam in the whole of history – pushed relentlessly by academia and the public sector against the interest of the western economies.
The satellites are the only credible measure of global temperature (the surface data being nothing short of fraudulent with so many different warming adjustments only a liar or an idiot would use it). And up until the start of the peak of the El Nino induced warming the satellites continued to show no warming for 18 years. That is 0.6C of warming PREDICTED by the climate extremists of the IPCC that did not happen.
Not only do the eco-extremists need this El Nino warming – but also after the El Nino, they need the temperature to continue upwards. It is already tittering of the brink – they are desperate to stop us saying 18 (soon 19,20) years without warming. If for a few months they silence us – the disappointment when it returns to cooling will surely be the end.
In contrast, the sane sensible people of this world, know there is a correlation between solar activity and temperature, that there might be a 60 year cycle peaking in 2010, thus explaining the small real warming from 1970-2000 (as opposed to the fabricated warming added to the surface data). And as a consequence, it is more likely than not (because what we know about the climate is much less than what goes one) to see cooling, not only straight after the El Nino peak, but for the next few decades.
So … here are the scenarios
1. Warming continues after El Nino (very unlikely)
This is the only scenario permitted by the Global Warming religion. However, because sceptics know we don’t know much about the climate, we can’t dismiss further natural warming as a possibility – albeit less likely than cooling.
2. Ambiguous “pause” (trend <0.05C/decade)
If the temperatures return back to the pre-El Nino level and continue the “pause” – albeit with a small warming trend, then the climate extremists will be shattered – their hopes dashed – as the pause lengths so that it will soon be the same length as the entire 1970-2000 “unprecedented” warming (the same warming occurred from 1910-1940 and there was far more warming in the Central England record from 1690-1730). However, the extremists – like all extremists will never admit defeat – and the anti-science eco-journos (like the BBC) will continue to pour their evil into the ears of the populace. Yes, the science will have disproven the global warming bullshit – but when you’ve got 1000x the funding of sceptics and lying cheating academics ready to churn out paper after paper … they don’t need science to maintain their belief.
3. The unambiguous pause (trend <0.0C/decade)
If however the temperatures return to a lower temperature than before the El Nino – then the game is up for these extremists. Cooling (of any kind) disproves their religion.OK – like all religions they will continue believing “the end is nigh” – but the sane sensible majority will stop listening.
However – the surface data will be continually upjusted to “prove” it is warming by the fraudsters. So, for real scientists – the pause will be unequivocal – but to the fraudsters, liars and gullibles who follow the religion – the fact we are not seeing warming (nor any other trends like extreme weather, floods, droughts) as they predicted will just be an inconvenient truth -easily explained away with fraudulent data and denier papers.
4. Unambiguous cooling (observable cooling)
When someone can produce a graph that most people will accept shows cooling, then the game will be completely up – even for the fraudsters. Unfortunately, because we know so little about what causes climate change, that could happen in as little as one year or as many as 100 years (or more). All we know is that cooling will occur and make the stupid episode of “man-made” warming look ridiculous. So, we can say with certainty that “history will not be kind to the climate extremists”, but we cannot say whether it will be us, our children, our grandchildren (or more) who will be reading that history.
So, within this scenario are several sub-scenarios to do with timing:

4i – warming then cooling (within a generation)
4ii – warming then cooling (over more than a generation)
4iii – cooling (within a generation – then warming/cooling/warming etc.)
4iv – cooling (over a period greater than a generation)

I’ve not put a scale on these – because they will be judgemental.  There is always warming and cooling in the climate – that has not changed – it’s just every so often the climate variabilities add together to create an apparent trend over a decade or more. So, the key will be when the general populace accept the warming trend has turned into cooling.
The best possible scenario for us sceptics, would be for the globe to show a sustained cooling trend for the next couple of decades (although not necessarily the best option for humanity as it will undoubtedly increase human misery and death). If that happens, then within my (expected) lifetime, I will be celebrating the collapse of global warming, the idiots who pushed it in academia, the BBC and e.g. “Royal” society.
That in itself might trigger a broader social revolution!
Ambiguity rules
However,the real nature of natural variation as seen in the climate (I have just realised) is that ambiguity rules (so this is almost an addendum). Unlike “scientific” (or white noise), which has no trends, cycles etc., the problem with real (1/f) noise is that it is full of apparent trends, cycles and steps. And as such – perhaps I should start calling it “ambiguous noise”. That is to say, 1/f noise, is noise that appears to have a signal – but does not. It appears to have trends – but does not. It appears to have “meaning” but does not.

Scientific (white) noise vs. Ambigous (1/f) noise

Posted in 1/f, Climate, science | Comments Off on Crunch Year for global warming (= the scam)

Requiem for Bob Carter: Ode to Natural Variation


The adapted piece I call an Ode to Natural variation. It uses (without permission) the original “Bob Carter Peal” by Lord Monckton. Please read the eulogy:

A clock tune in honor of a true man of true science

Technical details

The work starts with the original stanza. Then over the next two stanzas I add more  copies of the original with different delays and a few simple other effects.
Except for the last stanza all the sound is just one simple piano playing a single tune**, but if you find the work increasingly difficult to “comprehend” as I overlay first one then up to three additional copies (in the third stanza) – that is what is intended!
Like the tune, natural variation is not distinct from “normal” regular cycles – and so in theory should not be that difficult to understand. But like the music, natural variation is the combination of many many cycles each relatively easy to understand on its own but which come together into one uncomprehendable “symphony”. (Also listen out for the track played in reverse – the noise doesn’t start with a thud as the piano key is hit, but instead builds to a thud and stops short).
The final stanza starts with a flourish – and for a while the “heroic” tune holds its own. But it is increasingly drowned out as the full flourish of natural variation is introduced (now generated pink noise). Then I duplicate this noise, add some reverb,  wow & flutter which causes the sound to evolve into what seems like a heart beat … fading out relatively suddenly leaving the last notes of the “Bob carter peal” ringing out to the final silent pause.
**There are also some chirping sounds which I believe are due to aliasing between the various sample frequencies. I admit I tried hard to remove these unwanted perturbations – but like natural variation – they serve a purpose.

Bob Carter Peal

A clock tune in honor of a true man of true science

By Christopher Monckton of Brenchley

Posted in Climate | 4 Comments

Doug Brodie Letter: The Emperor’s New Clothes

To: Mr Pete Wishart MP, SNP Business Manager

Copy:
Ms Nicola Sturgeon MSP, Scottish First Minister
Mr Callum McCaig MP, Scottish Energy and Climate Change Spokesman
Mr Angus McNeil MP, Chairman of the Energy and Climate Change Committee
Mr Fergus Ewing MSP, Scottish Energy Minister
Ms Aileen McLeod MSP, Scottish Climate Change Minister
Mr Drew Hendry, MP for Inverness and Nairn
Ms Liz Truss MP, UK Secretary of State for Environment
Dr Euan Mearns, Energy Matters
Mr Paul Homewood, Not A Lot Of People Know That
Selected other politicians
Selected journalists
Selected campaigners

Dear Mr Wishart,

The Emperor’s New Clothes

I am writing to you in your position of SNP House of Commons Business Manager to challenge a contribution you made during a recent House of Comments debate on flooding which has a bearing on SNP policy. In that debate you claimed that the recent floods were due “in significant part to climate change”, obviously seeking to blame alleged, unproven man-made global warming due to CO2 emissions, and that Scotland “desperately needs” more onshore wind power.

With all due condolences to the flooding victims, I believe that both of your claims are unjustifiable and symptomatic of the fact that most politicians, yourself and Secretary Liz Truss included, seem to be suffering from a collective “Madness of Crowds” delusion on so-called “climate change” which causes those afflicted to become dogmatically obsessive and to block out all the clear evidence which runs counter to and casts doubt on their unquestioning climate change beliefs.

Alternatively they realise that they have  been taken in by the climate change scam perpetrated on us all by the UN IPCC (with the surreptitious original intent of promoting sustainability) but have timorously decided to say nothing and keep up the pretence to avoid having to ruffle international diplomatic feathers.

The problem is that our climate change policies are leading to economic and social disaster yet are certain to fail in their professed national and international decarbonisation aims, but UK government ministers continue to reject such arguments. Please allow me to show how the SNP could step in to take the lead in this situation by a justifiable change of climate and energy policy which could help avert disaster and earn the SNP the gratitude of the UK-wide general public.

To learn more please read my Open letter to Mr Pete Wishart, MP. It also gives comprehensive rebuttal of both your House of Commons claims.

Yours faithfully,

Douglas S Brodie

15 Sutors Gate

Nairn

IV12 5BW

Posted in Climate | 1 Comment

What Are The Chances Of Getting All These "Record" "Hot" Years?

There’s been some really appalling articles prompted by the idiot Mann who makes a frankly fraudulent claim (if it weren’t for the fact he’s so stupid he doesn’t realise how wrong he is) about the probability of getting a record warm temperature naturally.
So, I thought I would try to work it out based on the statistics of systems like the climate with 1/f type noise. However I don’t intend going over it in detail again so if you want details of 1/f type noise and how its stupid to try using Mickey mouse statistics on it here’s a few articles:

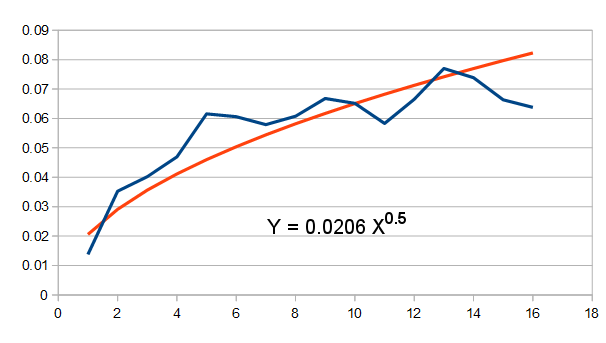
But fundamentally, the key nature of 1/f noise is that the variance INCREASES with longer periods. Below e.g. is a plot (I produced this using a 1/f type noise generator ).
 

Now for some stats. Given the above, if there’s a 95% probability of having a temperature of T0 in period P0, then as variance increases by P0.5
Then the temperature that occurs at the 95% probability limit (T) in a period P is given by

T = T0 * (P/P0)0.5

In other words (and ones Mann might understand) we expect both higher and lower temperatures over longer periods.
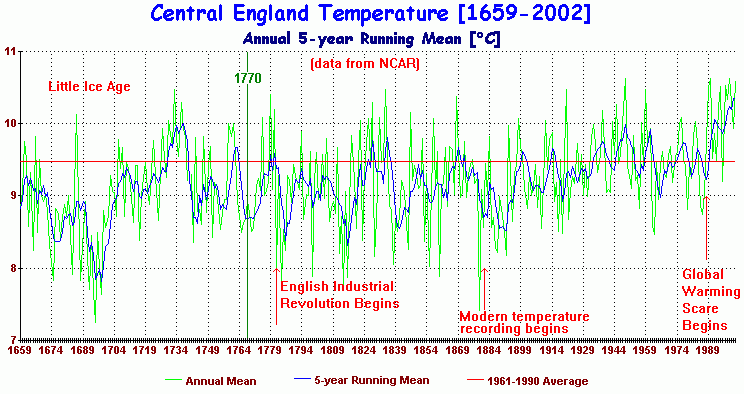
cet-1659So, lets see how that pans out with real data. Above is the best proxy for global temperature over the last 350 years. If we divide this into two, we see that the range in the first half went from around 8 to 10 = 2C (from 1690-1730).
Based on the rule above, we expect that minimum-maximum range to be 2 x 20.5
Or to increase from +/- 1C in the first period to be +/-1.4 over the entire period. Which tells us that on average the maximum we would expect is about 1.4 above the mid point of the first half  (~9C) which means we EXPECT a high of 10.4C
Looking at the Met Office data I find: “Average for 2015: 10.31C”. Which given the variance was higher than 2C means we are actually below expectation for the highest this century.
In other words, 2015 was exactly (or slightly less than) the maximum we would expect for 1/f type noise based on long term trends.
In other words the likelihood of the current temperature within the last 350/2 years is around 50% (half the time it would be higher half lower). In other words even this simple analysis shows that there’s a very high probability of having temperatures this “high”. Or to turn it around we’d be surprised if we did not see a temperature this high and it would not be that unusual to get significantly higher.
If however you add these facts:

  • All the warming from 1940s is attributable to the massive adjustments to the data Mann uses
  • IN ADDITION urban heating adds to that with an ADDITIONAL warming trend
  • IN ADDITION poor siting of stations has caused addition warming
  • IN ADDITION there is undoubtedly fraudulent changes to individual station data
  • IN ADDITION there are intentional changes to the method of calculating the figure and selecting sites in order to manufacture further warming.

We are getting to the point where it is almost certain that 2015 would be the highest temperature on record – because (in my opinion) if the fraudulent people using this bogus & knowingly poor quality surface in preference to the much superior and global satellite data data wanted it to be – they could also make it the coldest year of record.
So what does the idiot Mann say:

the likelihood that 13 of the hottest 15 years would be in the past 15 years is 1 in 10,000. The likelihood that 9 of the 10 hottest years occur in the past decade is 1 in 770.

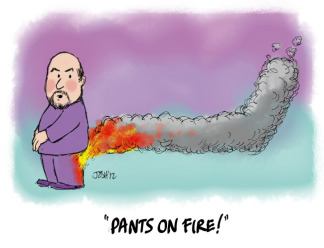
pants_afire_scr

In case it isn’t blindingly obvious how this trick works let me show you:

Here is my own new improved version of the global temperature where I’ve now “compensated” for all the introduced warming by adding a completely arbitrary cooling (which just happens to make this year coldest):

The new Sceptic HADCON dataset

The new Sceptic HADCON dataset


Now, like Mann, I can confidently assert using the same buddy reviewed work that there’s only a 1 in 770 chance that the temperature would be this low. And like Mann as a Nobel prize winner I now expect to receive millions in grant funding based on my “science” (the EU were awarded the Nobel – so as a very reluctant part of the EU – I can make the same FALSE claim to have a Nobel). LOL
Addendum
Also – because natural variation is a 1/f noise it tends to stay high once it is high or stay low when low. So if one year this decade is high – it’s a pretty safe bet that they all will be on the high side. So, it’s a pretty meaningless statistic looking at individual years.
The best way to approach the question is that I presented in this article: Proof: recent temperature trends are not abnormal. (in terms of statistics – this again confirms around 50% probability of getting this very normal temperature/trend – using a range of time periods for comparison)

Posted in Climate | 2 Comments