This article is one of a number I’ve been doing developing my ideas on the Ice-age cycle. I will try to summarise the key ideas and explain how they fit. However, with such a complex subject and so many new ideas I cannot cover everything. Instead I will focus on the key ideas and ask you to read other articles where necessary.
Summary
The Caterpillar theory is just a statement of science – in that warming and cooling will cause expansion and contraction and that must modulate volcanic activity. The only part needing additional evidence is to show that heating and cooling of just the top few kilometres (the most rigid part) dictates the plate movement. If so, the 40 -100k time delay between ice-age cycles represents the time it takes for heating and cooling to penetrate the crust.
I have explained in previous articles how the Milancovitch orbital changes can trigger expansion. Because when the crust contraction is slowing down as the temperature equalises at the end of the ice-age, a very modest induced warming from the change in orbital cycle can turn contraction into expansion. If this expansion then leads to the emission of volcanic gases, and that in turn leads to further warming, this explain how a very modest Milancovitch cycle change in temperature is a “trigger” for a massive additional change.
However I still needed to find a plausible explanation to link volcanic emissions to the runaway warming that takes us from an ice-age to an interglacial. For this the emission of volcanic gases, must also trigger further warming, but also it is necessary to explain why this “runaway” warming stopped – because unless there is a mechanism that stops warming as we go into the interglacial – warming could not stop and the world would fry (which is why runaway global warming in an interglacial is nonsense).

Clouds
It is well known that the ice-age periods are not only colder but drier than the inter-glacials. Therefore a very likely candidate for stopping this runaway warming is increased water on the land surface. And the most likely mechanism for this is that increased water in the earth’s atmosphere leads to increased cloud cover – which in turn leads to reduced transmission of heat and light through the cloud cover blocking the suns heat. Thus a small increase in water near to the “saturation” level of the atmosphere can rapidly lead to clouds that stop further warming (as per a sunny day). Thus water can create a very stable “end stop” effectively preventing further warming.
But it has been problematic explaining how volcanic emission led to warming. No single effect is enough to explain the ice-age cycle. CO2 has been suggested, but the direct effect of additional CO2 is very modest (and certainly not sufficient to explain the massive warming). Previously I had tentatively suggested CO2 induced changes in plant growth which in turn moderated H2O (a far more potent greenhouse gas). The suggestion here was that CO2 promoted plant growth (plants love- CO2) and in turn, because plants take up water from the soil and release it to the atmosphere, the increase in plant cover would result in a large increase in atmospheric water vapour. Water vapour being a potent greenhouse gas would then massively increase the greenhouse effect from the very modest contribution of CO2.
However, given the small land surface relative to oceans, although it is possible to envisage a large change in atmospheric H2O across the land surface, it was not possible to envisage a similar change across the oceans. Thus the scale was still not large enough to explain the full change in ice-age temperature.
I have also suggested changes to the Hadley cell structure (and re-enforced by changes in ocean currents) – whilst a change in Hadley cell would lead to dramatic changes in climate and also a change in oceanic currents which tended to re-enforce any change (so it would tend to be bi-stable) – the mechanism explaining why this change would occur in the first place was missing.
Now however, if we add a change in atmospheric pressure to the mix, we not only have a direct greenhouse warming effect due to the change in the pressure of the atmosphere, but also increased pressure substantially promotes plant growth, and also pressure has a direct impact on atmospheric physics providing a plausible explanation for a flip in the Hadley Cell structure.
Put together I feel that the scale of warming is now sufficient to explain the massive warming seen as we come out of an ice-age.
Introduction to (real) Atmosphere greenhouse model
(Note: this is not the called “skydragon” model)
The (real) atmosphere greenhouse theory is a model developed to explain & incorporate both the heat-trapping properties of so called “greenhouse gases” as well as the pressure induced greenhouse effect.
One of the main advantages of this model is that it avoids the non-scientific aspects of the “heat trapping” model where CO2 (and other greenhouse gases) are only considered as trapping IR (an assumption that breaks the laws of physics because real molecules like CO2 both emit and absorb CO2 – and this & other non-physical aspects of this model cause many people to dislike it passionately)
In the real atmosphere, greenhouse gases both emit and absorb IR. And the scale and sign of this effect is a function of the temperature of the CO2. This important science is ignored in the heat trapping theory. The result is that the heat trapping model glosses over very important aspects of heat transfer in the atmosphere with the result the implied “atmosphere” has no mechanism to explain or maintain its own temperature – a very serious problem when this supposedly the main parameter that it attempts to explain.
So this key parameter – the temperature – is undefined, unconstrained, unrealistic and so, whilst all models are just simplifications, the heat trapping model is particularly bad as it breaks some very basic physics. This does not mean there isn’t a greenhouse effect – it just means the heat trapping model distorts the reality of what greenhouse gases actually do and thereby leads to false conclusions.
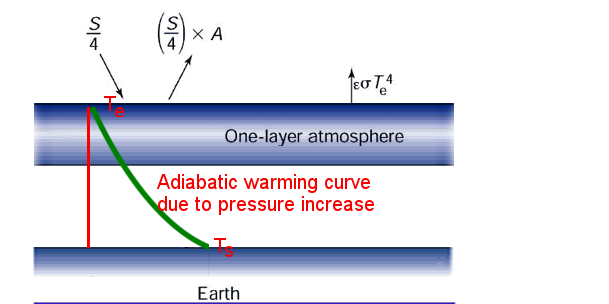
Removing all the irrelevant components from the Penn State “opaque atmosphere” model, we are left with the above.
The (real) atmosphere greenhouse model treats the atmosphere as a real body with a temperature profile caused by the lapse rate (as shown schematically above). And the “greenhouse” effect is the difference between the temperature at the effective radiative layer and the ground.
The key is to understand that the key temperature of the earth is not the surface – but instead it is the temperature “as viewed from space”. This temperature is easily calculated from a simple black body model of the earth.
The main concept to help explain how the greenhouse effect works is to view the atmosphere as having an “effective radiation level) – which is a virtual layer at the average height at which radiation leaves the earth across all radiation frequencies. Or in terms of the model: it is height at which the atmospheric temperature is the same as the average temperature of the atmosphere viewed from space.
Because we know the temperature of this virtual layer – and we know that for most IR frequencies emissions occur from near the top of the cloud layer, it is easy to see how the temperature profile from this virtual layer down to earth creates the greenhouse warming effect.
But, because there is a great deal of variability of the opaqueness of the atmosphere at different radiative frequencies the effective height at any frequency can vary dramatically. So this “layer” is only a “virtual layer” representing an average across all wavelengths.
However, as air movement and cloud formation is one of the main heat flows in the bulk lower atmosphere and as they form clouds which are one of the key vectors for emitting heat away from the earth. The atmosphere is largely opaque below and transparent above this layer. So this “virtual layer” can be very loosely equated with the tropopause. (the top of the main cloud layer).
Implications of (real) atmosphere greenhouse model
Thus the “greenhouse” effect, is the difference in temperature between the “radiative layer” above the bulk of the atmosphere and the surface. This is a like any insulator such as a coat – there is a heat gradient which creates a barrier between a cooler and not region. But in the atmosphere there is a fixed thermal gradient because the temperature change is mainly due to a physical property of the atmosphere: the (largely) fixed temperature change with height.
This temperature change is because of the potential loss of energy of air. To explain simply: one 1kg of air to rise 1000m, 10,000 joules of energy are required. In the atmosphere, this energy comes from heat. So heat is lost as air rises and turned into potential energy. If we know the thermal heat capacity of air we can calculate the lapse rate. This figure is around 9.8K/km for dry air – ~6.5K/km for moist air.
Thus., the greenhouse temperature can be changed in two ways:
- By a greater quantity of gas – so that the air is more dense and the atmosphere is thicker which causes the effective radiation level to rise (hence a greater height and so potential difference between the surface and this “layer” – thus more energy changes from heat to potential if air rises to this level)
- By changing the mix to include more radiative opaque molecules like CO2 and H2O. Which being opaque tend to increase the effective radiation height thus increasing the temperature rise from this “layer” down to the ground.
(The best analogy here I have is to imagine a wood of trees winter – with a few evergreens like holly. If the wood is the “atmosphere”, then the hollies are greenhouse molecules. If there are no hollies we can see quite some distance into the wood. But even a few holly trees will dramatically change the distance we can see. So, even a few holly trees can dramatically reduce the distance we can see into the wood. Similarly, though few in number, a small change in CO2 can significantly change the effective radiation height.)
Implications of the real atmosphere model to long-term climate
Whilst all models are just simplifications, how we simplify a system can be a powerful scientific tool (and in turn also a political tool).
The problem with the heat trapping model is that it implies “an imbalance” and thus promotes the idea of”runaway warming”. The (real) atmosphere greenhouse model is just another simplification of the same far more complex climatic system. However, because it sees the addition of CO2 as a small step change in the effective radiative height this rightly sees the effect as a small change from one equilibrium position to a slightly different one (about 100m-400m for a range of 0.6 to 2.5C).
However, sometimes models also provide insights that were not obvious: I now realise that a simple truth had been staring at me through this model. I had just been focussing on the change in composition and its effect on temperature, but in doing so I was ignoring the other important effect and whilst composition is important, volume is by far the bigger potential change. So it follows that where we see a temperature change of the earth – the first place we should look for any “culprit” (unless there is strong reason against it) is in the pressure (or volume) of the atmosphere and not gaseous composition.
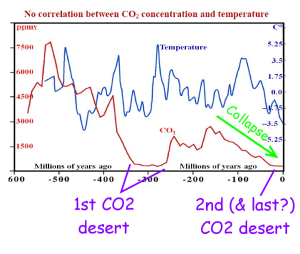 So, when we look at the average temperature of the globe, such as the graph to the left which is intended to show temperature versus CO2 as a first approximation we should consider the average temperature to be a proxy for average pressure. That means a rise in temperature is most likely indicative of a rise in the pressure of the earth’s atmosphere (or as the two are linked: volume), and visa versa a drop in pressure is mostly due to a drop in pressure.
Obviously the composition and particularly the relative composition of the atmosphere is important. Also the mechanics of cloud formation are also important. But generally we can describe the temperature as the combination of two effects. So we might find an equation of this form:
T = ε f(P)
Where f(p) is given by an approximation similar to the empirically derived formula shown below:

Click to see original WUWT article
And ε is an effective emissivity representing the change in relative composition in IR interactive gases (an effect which is itself a complex function of gas composition, pressure and other non-linear effects like cloud formation).
Implications to Ice-age cycle
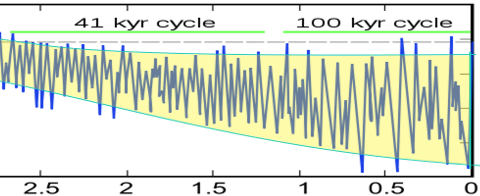
Below is plotted a proxy for global temperature showing that the global temperature has changed significantly in a cyclic way for at least the last 2.5million years.
 According to the (real) atmosphere greenhouse theory, there are two main factors (three if we count clouds separately) that can change:
- Total quantity of the atmosphere
- Relative amount of IR interactive (or Greenhouse) gases.
And, unless we have evidence to the contrary, not only must we consider both possibilities, but by far the stronger effect comes from total volume of gas in the atmosphere.
The leaky atmosphere hypothesis
For reasons which are obvious given the necessary escape velocity of ~40,000 km per hour and the infinitesimal amount of the atmosphere that reaches this speed (even at the elevated temperatures in the ionosphere) the earth is usually considered a sealed container from which nothing can escape.
However, that is usually falsely assumed to mean that nothing can escape the atmosphere – which is then taken to mean that the atmospheric volume is constant. An easy mistake to make – but upon reflection given the huge bulk of the earth and the thin layer of atmosphere, it is just implausible. Because if for no other reason:
if the atmosphere is a sealed container, how then an the composition the atmosphere change?
The answer of course, is that whilst the atmosphere is sealed into space, it is far from sealed into the ground.
The inverted earth

The Inverted earth model (here height = 1/real height)
If this isn’t obvious lets have some fun! Models are important and so in order to visualise the real earth, imagine we redraw the earth “inverted”. So, now instead of the centre of the earth (as left) being a fiery ball, the centre is now the cold of infinite space, and now instead of the “outside” being the cold of space, the “outside” is the earth’s interior. Now, the “sealed container” idea of the atmosphere starts to look ridiculous. Because whilst the atmosphere obviously cannot leak “down” into the impenetrable interior – it can and obviously does leak into and out to the earth’s crust.
OK, that is just some fun, but conceptually, when we start considering the atmosphere leaking down into the ground, the limit that atoms cannot easily escape into space has disappeared. Now the limit is how much atmosphere goes “out” into the ground and comes “in” from it. And now there are many mechanisms whereby gases can and are lost:
- Volcanic activity
- Burning fuels
- Decomposition
- Nitrogen fixation by plants
- (very slightly) Acid rain from CO2 and chemical reactions.
- The pesky snails (and other shelled animals) stealing carbon and depositing in rocks
- Oxidation of minerals and carbon.
- etc.
Hence there are very good reasons that over geological periods we may see dramatic changes in the earth’s pressure. And if the atmosphere were “leaking away”, this would explain the long cooling we see as we go from inter-glacial down to the coolest part of the ice-age just before it is triggered into warming. But what then causes this warming?
The caterpillar theory
For more depth see here
The caterpillar theory simply states that when the earth’s surface heats up the crust also heats up and expands – and that forces the top layer of rock at plate boundaries to be pushed together, so that one plate is forced down below the next. It also states, (drum roll) that when the earth cools down (trumpet call) the rocks ….. (can you guess) … yes they contract (sorry this is just so obvious). This in turn causes the rocks to be pulled away from each other. And this effect is most pronounced at mid-oceanic ridges.
And there has recently been found very strong evidence this is happening from a modulation of the rock types at the mid-oceanic ridges.
Volcanic activity is involved in both parts of the cycle, but because we have tow types of volcanic activity subduction (and rocks pushed down where there is thermal decomposition) and simply contraction, the two parts of the cycle promote different types of rock formation (and through thermal decomposition of surface rock with lots of carbonate rocks and hydrocarbons) the various parts of the cycle favour the release of CO2 and hydrocarbons (like oil and gas).

In addition the theory states that the time between cycles is determined by the time it takes for the “hard” surface rocks to expand/contract + the process of heating is part of a runaway warming effect initially triggered by a modest amount of warming from the Milancovitch cycle. (but please see
more detailed explanation)
However, the problem with the theory as originally stated was that there was no plausible mechanism whereby the triggering of volcanic eruptions would lead to the necessary change in temperature. (The relative change in CO2 concentration being far far too small).
At the time I hypothesised two other mechanisms:
- A change in the Hadley cell structure (see explanation here) – something very hard to explain – because it required a dramatic change to the atmosphere
- A change to the H2O cycle whereby CO2 promoted plant growth, which in turn vastly increased transpiration and then led to a massive increase in cloud cover.
However, neither looked promising as a total explanation. The first required a massive change with no obvious mechanism to trigger that change. The second, whilst a very good explanation as to why rapid warming by hit a “hard stop” (so that the interglacials were always at roughly the same temperature) it required a massive change in greenhouse gas effect from H2O.
The changing atmospheric pressure hypothesis
When I originally introduced the idea that atmospheric pressure might have caused the ice-age cycle I used the Niklov Zeller equation and calculated that the required pressure change was around 30% based on following graph (note normal day-to-day changes of pressure are around 10% – so this is large):
 However, as no one else was even considering long term changes in atmosphere I was very cautious and only offered it as a suggestion. However after reflection and now that now that I understand the full implication of the (real) atmosphere greenhouse model and that any change in temperature (in geological time periods) is likely to also mean a change in pressure, I should not just speculate but formally include a change in atmospheric pressure into my ideas.
Now, the ice-ages would be a period of lower general pressure. The inter-glacials would be periods with higher overall pressure. However, because pressure works with other effects the total pressure change required to cause the ice-age temperature change may not be anywhere near the 30% originally needed. Because:
- We now have the significant change in atmospheric properties which would be needed to change the Hadley cell structure.
- Atmospheric lower pressure in itself would tend to dry the world (the water vapour pressure is constant – so lower atmospheric pressure allows more evaporation).
- Higher pressure would also dramatically add to the CO2 and H2O greenhouse properties. So, not only would the release of CO2 increase the effective emissivity (ε in above equation) – but by increasing the volume and pressure of atmosphere IN ADDITION f(p) would increase.
- An increasing atmospheric pressure + increased CO2 would both increase plant growth and that in turn would increase transpiration and release of H2O into atmosphere. And as H2O is a far more potent greenhouse gas that CO2, this effect is very significant.
Brief Explanation of how pressure effects Hadley cells.
To explain the Hadley cell we must understand that winds on the surface of the rotating earth are subject to the Coriolis effect. This effect tends to cause air flows to move to the right in the northern hemisphere and to the left in the south. The scale of that effect is given by the Rossby number:
R = U/fL
Where U is speed, L is length and f = 2ωsin (φ) (related to angular velocity of earth and latitude)
The lower the R value, the more the atmosphere is affected by the Coriolis effect. Or to put it another way for the same R value (and same latitude & day length)
L ∝ U
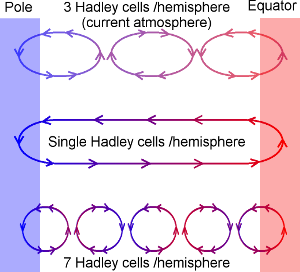
Thus higher wind speeds tend toward larger Hadley cells. And with a reduction in atmospheric pressure, not only is there less air resistance (zero in a vacuum) but there is less thermal mass to move heat through the atmosphere – so for the same heat flow wind speed must be higher. As a result, reducing pressure tends to increase average wind speeds and therefore tends to push toward larger Hadley cells. And if we are on the edge between a 3/6 Hadely cell structure and 1/2 as I suggest, then even a modest change in the Rossby number might trigger us to flip. (Note there can only be an odd number of Hadely cells in each hemisphere due to warming at the equator and so rising air – and cooling at the poles.)
Remaining issues
A few issues remain. There is no evidence for atmospheric pressure change – largely I feel because no one has even considered it plausible that we might be seeing such changes. (When I searched there were no papers on the subject)
Also CO2 tends to lag temperature rise in the ice-core. A possible explanation is that the initial volcanic release of gases are of non-CO2 gases and/or plants very quickly absorb CO2 retaining the low level – so that pressure rises whilst CO2 levels remain constant – and perhaps only when enough CO2 has been absorbed do processes of decomposition start to take off and release it back into the environment.


Long -Term Climate Change: What Is A Reasonable Sample Size?
And the answer is fairly simple.
For a reasonable degree of certainty (~75% – but see end) One needs around 10x the length of time of data of the length of time in which we are taking a trend – and all the data must be from one homogeneous source. So, e.g. in order to assess whether the last century was abnormal, we need around a millennium of data. In order to assess whether the 1970-2000 warming was abnormal, we must compare the 1970-2000 trend in CET with the last 300-350 years in CET. And the longest period in the raw instrumental dataset of ~160years that can be assessed for abnormality would be around 16years.
So, if you hear anyone say “the pause is ‘abnormal'” – that might supportable (but is not). If however, they say “the last 30 years is abnormal” or even “the last 100 years” – they are either stupid, fraudulent or insane.
However, it all falls apart if we start comparing apples with cheese: tree rings for 1000 years with bogus fraudulent surface data for 30 years. Becasuse, for example, if we look at what kind of change is normal over the last 1000 years in the tree ring data – then we must compare it the same data for the last 100 years. But in contrast – the whole “hide the decline” scandal, was that, not only weren’t they comparing tree ring data with tree rings, but they knew that the tree ring data showed entirely the opposite trend from that they were stating to have been shown to be “abnormal”. With fraudulent behaviour there is no way to make their assertions credible by merely adding to the (bogus) data.
However, as 10x the data is problematic when we need quicker indications, I would suggest that we can get a “more likely than not” indication for 3x the period. But now it is critical that those doing the assessment come from the right background (which means tried-and-tested-engineering and not woolly-pc-panic-stricken-by-any-change academia.
So, e.g. with 160 years of data, we (engineers) can start saying with a modest certainty that if the last 50 years showed warming that had not been seen before in the last 160 years, then something was odd. But, just to show how ridiculous that assertion would be, even using the bogus upjusted data, the 1970-2000 period shows the same warming as 1910-1940. So, there is no indication of any abnormality with the global temperature (despite the known upjusting which in itself tells us just how normal the present period is – that even fraudulent changes can’t change it enough to make it abnormal).
The rational for long periods of data:
Until we know what is normal we cannot know what is abnormal
To take a simple example, we have two flight computers on a space craft – one says “full throttle”, the other “cease throttle”. How do we decide which is correct? The answer is that unless we have additional information there is no way to even guess which is correct.
If however, we have three computers, two say “cease throttle” and one says “full throttle”, then all other things being equal, then if the chance of any computer being wrong is p. Then the chance of two being wrong is p2
So, the chance of two computers being wrong as opposed just one is p2/p. So as p<1, then irrespective of the actual value of p, it’s always more likely than the minority is abnormal.
Likewise, at the very least, we need three centuries/decades of data to even start guessing which decade is “abormal”.
So, why 10x the length of data? The reasons are many:
The rule of 10
In essence, this rule simply means we need an awful lot more data than we think we need by “academic” statistics – because the real world is full of real people who just don’t think in the way needed for “academic” statistics to be valid.
The biggest problem is that we usually start looking at data when something “odd” appears. (Or to put it another way we ignore data where nothing odd appears) And, by pure chance, if we continue to monitor data, for long enough or from enough different sources, sooner of later by pure fluke, we will see an odd “event”.
As such, when we start assessing the risk of something like “climate change” we are not just picking data at random. Instead we have already “cherry picked” a period which appears odd. So, by pure probability, if we monitored 100 metrics, one of of those 100, should have a signal that only occurs 1/100 of the time in that signal. In that case, we would need 100x the data before that 1/100 signal would be within a sample where it was likely to occur. (but even then another such event should have occurred, so there is twice the probability of this event than would occur by pure chance – just because we only focussed on something that appeared a problem!)
But the untrained human factor gets worse
But, even with simple data, there are so many ways to take the same metric and suggest “abnormality”. Taking temperature, we can for example look for “hottest” and “coldest” (2). Also “faster warming” and “fastest cooling” (2). Then we have the possibilities of turning points(2) and cycles(>2)** – all of which can be construed as “odd”. So, even with simple data, there are around 10 different ways to see something “odd”.
So, quite contrary to what the statistics supposedly suggest, it is actually “normal” to see a 1-in-100 year event in a decade of temperature. It is also normal to see a 1-in-1000 year event in a century of data. So, if you are just looking for something “odd”, in around 10 different metrics, the chances are you will see a 1-in-millennium “event” every decade!!
The human factor
So, if we are intent on finding something “odd” in even one dataset, the chances are quite high and that is why we need long time series. If however, we have a host of datasets (floods, droughts, snow, temperature, rain, hurricanes, peak-rain, peak-wind, peak, rain, etc. etc.), then if we are allowed to cherry pick as academics have done, then we are guaranteed to find something abnormal.
This is why one needs to be properly trained in engineering practices to do risk assessments. Because the biggest quality failing of risk assessment is the idiot doing the risk assessment – and particularly if they don’t come from a culture used to doing risk assessments and living the with result of either overstating risk or under-stating it.
So, even with the best of intentions, and even with 10x the data of the period being assessed, the best we might say is that there is “more chance than not” of some data being abnormal, if (as has happened) you have politically motivated groups free to scour the data and worse – free to channel resources – with the intention of finding “something wrong”.
If however, you have people trained in risk assessment from a suitable culture, who know the temptation to cherry pick data and have the training, experience AND culture to resist, then the the certainty with 10x data can rise as high as perhaps 90% confidence. (Note the idiots at the IPCC have stated 95% confidence, about a period equivalent to the length of their whole dataset – so whilst they have no idea & no data to say what is normal – they are 95% sure that what they have is abnormal).
**To explain, if we accept a turning point is simply a variant of a sin-wave (with period twice the sample length), then a trend is a variant of a cos-wave. Then a simple cycle (up-down-up-down) is just twice the frequency. However, if the probability of this is half as high (there being twice as much “info”), then if we sum the total series, the probability of the total is around 1. However, because we are looking for things “happening” … we can often accept cycles that only appear later in the data. So, there is quite a high chance of seeing something “odd” in the form of an apparent cycle.