[As JK rightly highlights I stated ECS as 1. It should have been stated as a temperature. Using a typical figure for the effect of CO2 without feedbacks this would be 1C. However, that 1C figure is itself disputed. Prof Hermann Harde suggested a 30% lower figure based on latest HITRAN data which I understand would be ~0.6C. To avoid going into this complexity, please read ECS as meaning Equilibrium Climate Sensitivity relative to Equilibrium Climate sensitivity without feedbacks (~1C)]
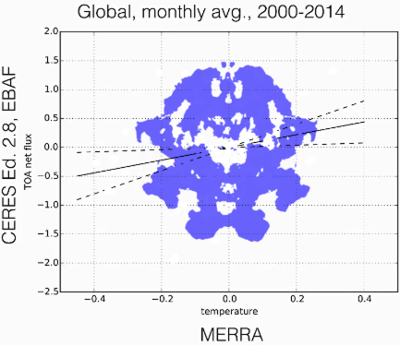
After watching Andrew Dessler “Noddy” presentation on Equilibrium Climate Sensitivity, I was left in fits of laughter by the contrast of his shear arrogance & lack of experience with feedback systems and the appalling data in this graph:-
 You could read anything you like into that and he did! He may as well have shown this:
 However, as he’s put it on line, I’m going to restrain myself further. Instead I will present a very simple argument that almost anyone should be able to understand showing that climate sensitivity is less than 1.
Proof climate sensitivity is less than one
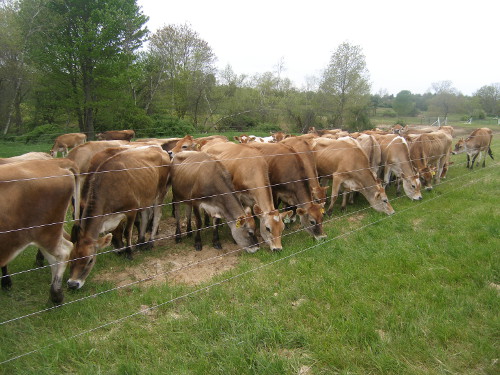
I struggled to work out a way to explain to people who apparently have no comprehension of real systems how engineers can understand what is going on better than they just by looking at the system. Finally I hit on a very simple analogy:
Notice how the fence keeps the cows to one side. As a result, the fence affects which parts of the field the cows eat from. This in turn affects the grass. So, now I want to show that even if you only can see the grass, you can understand where the fences and barriers are just by looking at the pattern of grass.
Below is an aerial photograph of Guilwell Scout campsite. The image is of a marquee (a kind of tent). We cannot see what is inside this marquee in this photo, nor when it is taken down. But we can the grass. Can I tell without ever seeing the obstacles inside, the pattern of objects and places where people did and did not walk?
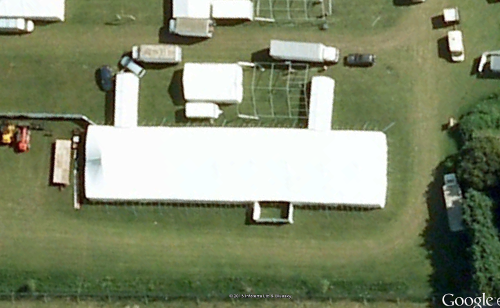 Below is the aerial photo of the same area. Here we can quickly see a lot of detail within the tent. We can immediately see that the two extensions to the top were entrances as they clearly show the browning of the grass characteristic of wear from where people have been walking. And by observing those areas which have not browned, we can also see areas within the marquee where people have not walked.
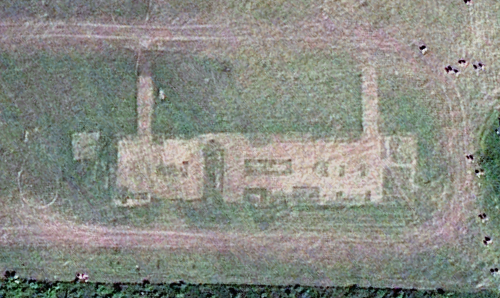
From this I can guess that there were tables at the top, bottom and centre. Looking at the centre and bottom rectangular patches, I see that within the clearly defined rectangle, there are further irregular brown patches. These are typical of areas where people have been sitting for long periods and the inner brown patches are where their feet bave been resting on the ground. Also there was a large obstacle about 1/3 of the way from the left.
So, even though I have never seen the boundaries, I can tell where they are from the pattern of “data”. The boundaries dictate the patterns we see. And even if we had not seen the tent, we could still very clearly work out its shape.
So let us now look at the ice-age cycle:-
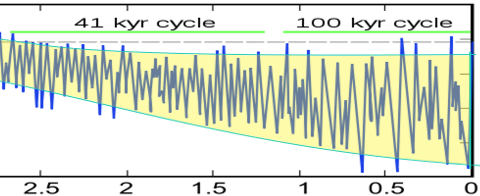 Here, like the clear line of the fence, there is also a line representing an upper boundary to global temperature in the ice-ages. But unlike the lower boundary which is changing, the upper one appears to be constant. This boundary is not a “hard” boundary in the sense that absolutely no cycle exceeds a particularly threshold, but like the cows at the fence reaching through, we can see from the way the cycles tend not to exceed a particular level that there is some mechanism that is stopping them from increasing temperature.
To put that in more technical terms, there is level corresponding to the current inter-glacial temperatures whereby further temperature rise become increasingly difficult. This shows that negative feedback is dominant in the interglacial.
That is to say that as temperatures increase, the Equilibrium Climate sensitivity will reduce tending strongly toward a negative feedback (ECS<1) as temperatures rise. Therefore if (as we are told) we are at an “unprecedented high”, the scale of negative feedbacks will also be unprecedented. So it is very likely:
ECS < 1
I might add that independently the temperature signal shows none of the characteristics that would be expected of a system with large positive feedbacks, so I am reasonably confident this is right (to translate to Dessler’s language: I HAVE NO DOUBT AT ALL THAT I’M RIGHT).


Thanks,
A couple of questions.
1) Could you be a bit more precise about how the 1 corresponds to negative feedback? Is this just a rounding down of the no feedback sensitivity to the nearest integer?
2) I think that Dessler’s language sounds a bit strange because it comes from the IPCC’s definitions:
Virtually certain greater than 99% probability
Extremely likely greater than 95% probability
Very likely greater than 90% probability
Likely greater than 66% probability
More likely than not greater than 50% probability
About as likely as not 33 to 66% probability
Unlikely less than 33% probability
Very unlikely less than 10% probability
Extremely unlikely less than 5% probability
Exceptionally unlikely less than 1% probability
To my listening Dessler is equivocating between “Very likely” and “Extremely likely” that ECS is greater than 2C. That is, my understanding of his claim is that he reckons there is about a 5% chance he is wrong. (Note, in particular, that we don’t hear “Virtually certain”.)
Your translation of this is “I HAVE NO DOUBT AT ALL THAT I’M RIGHT” – in all caps. That would seem to be stronger than even “Virtually certain”.
The statement “I HAVE NO DOUBT AT ALL THAT I’M RIGHT” – in all caps – conveys to me more than just a quantitative difference. It conveys a qualitative intolerance and inability to question. I find that hard to get from Dessler’s statements in his talk here.
My question is could you elaborate a bit on what you mean? I can imagine various interpretations (perhaps based on Dessler’s statements and behaviours elsewhere?). Suppose a climate scientist really did estimate the chance that they were wrong as around 5%. How should they convey that, if not using the IPCC language? Given the IPCC convention it looks to me as if Dessler near enough saying in so many words that he thought there was around a 5% chance he was wrong – but that is not how you understood it? Do you just think that it’s absurd to say that anything important in climate science is ever that certain, so such language is always ridiculous?
3) I think your use of the term ‘proof’ to describe your argument is unwise. I’m unclear whether it’s ironic or just loose language. Talking in everyday terms is fine for everyday folk who can understand everyday language. But your post seems to be aimed at academic dummies. In trying to talk to such people I recommend trying to use words as precisely as possible, and they will probably take a ‘proof’ to mean a much stronger argument.
If what you’ve presented is just an analogy to explain how the proof works for people with no engineering experience, then it would be helpful to add a link to the actual proof.
OK, let me be honest and admit that I was thinking of total gain of the system rather than temperature, but easily done with a change due to doubling CO2 of around 1.0C.
However as I understand from Prof Hermann Harde’s work the 2007? HITRAN database gives about 30% lower figure of around ~0.6C. So even modest positive feedback would be less than the “1”.
So perhaps I should have written ECS < 0.6C for a doubling of CO2?
On the point about the language. I started using expletives when I saw the first graph. You can't present something like that and not expect a bit of mockery! And When Kessler then went onto models that fail to predict the climate and started using them as "proof", … Obviously there's a very different idea of certainty than I have.
“Proof” – I was reflecting Kessler’s own standards. Personally I might have said: “this is strong evidence indicating …”
Thanks for the useful clarifications.
I’m not sure about the changes to HITRAN. I’ve only had a chance to look briefly, but I see that IPCC fifth assessment does discuss this in chapter 8, section 8.3.1. It might be useful if you either did a critique of that section of the IPCC or gave a pointer to Prof Harde’s work. (See http://www.ipcc.ch/pdf/assessment-report/ar5/wg1/WG1AR5_Chapter08_FINAL.pdf )
On the idea that Dessler is claiming I HAVE NO DOUBT AT ALL THAT I’M RIGHT, I still think you’re being a bit harsh on Dessler.
I agree the graph doesn’t look like it gives much useful information. But how does Dessler describe it? He says he agrees with Lindzen that it is ‘grotesque’, that the data ‘are not great’ and that one error bar gives zero correlation.
Did he claim the models were ‘proof’ of anything? I don’t think so. He said in the case of the Planck feedback and the relative humidity feedback that it was the agreement of models with observertions FOR THOSE SPECIFIC FEEDBACKs combined with THEORETICAL ARGUMENTS about the feedbacks that gave him ‘high confidence’ in the Planck feedback and mad him ‘very very confident’ about the relative humidity feedback.
He was more qualified in his assessment of the of confidence in the lapse rate feedback and said that agreement of models with observations should give ‘some confidence’ in the albedo feedback – again making the point that there are independent reasons to believe that the albedo feedback is positive.
He then qualifies his overall statement on the no cloud sensitivity by saying ‘at least in my judgement, there’s not a lot of uncertainty’. Maybe we have different standards, but to me that doesn’t sound like I HAVE NO DOUBT AT ALL THAT I’M RIGHT or that he will not brook discussion.
Then he moves on to clouds. Here is the only time he talks about proof. He specifically says that although we should ‘take the correlation [between long and short term feedbacks] seriously’ that it’s ‘hard to prove it’. So he specifically does not talk about proof.
Then I see I made a mistake in my prior comment. I previously said he thought positive cloud feedback is ‘Extremely likely’. But actually, he is closer to ‘Very likely’, as he says, 9 out of 10 that ECS is greater than 2 degrees, and only really commits to ‘Likely’. So again, I just don’t buy that he has set the standard that you used.
And of course, when we are at our best we do not use our oppenent’s standards as our own – we do better.
JK thanks for posting.
My original article is here: http://scottishsceptic.co.uk/2013/11/13/hermann-harde-greenhouse-effect-30-smaller-than-ipcc-says/
At that time he said that the main difference was using the 2008 (not 2007 as I said) HITRAN database.
He then brought out a paper:
Harde: http://www.scipublish.com/journals/ACC/papers/846
Unfortunately, rather than sticking to his area of expertise which is calculating IR gas absorption he portrayed it as a climate model.
The problem with the models are that they have no skill predicting climate.
This is my very first article on Climate: http://www.lenzie.org.uk/scam.php done in 2007 and then updated in 2008.
Based on the Met Office’s only probabilities I seem to recall the chance they would all be so wrong was something like 1 in 2000. (or 20,000?) And none of the climate models predicted the pause.
So, none of the models have shown predictive ability. So, to then use these models that do not work, with data that looks like a shotgun blast and then come up with any confidence more than either the original shot-gun data or the almost complete failure of the climate models is false.
So rather than “very very high”, I would suggest the appropriate level of confidence is “extremely low” at least until any predictive power has been demonstrated.
So, really the only thing that can be said with any confidence is that CO2 is expected to warm the planet. That means you could start with the ~1C warming.
I would then argue the feedbacks need to be negative, you would argue they need to be positive. If my view were not taken into account, then one might estimate the effect of CO2 based on a small amount of positive feedback.
But even if I disregard that I expect negative feedbacks, I would be extremely reluctant to suggest postiive feedback greater than 2. At that kind of level I would expect to see characterisitc changes to the signal with ringing and all kinds of things. I just don’t see them. So even discounting all negative feedback, I’d say 50% … of 1.5C max.
But I’m certain there are better people with more experience of feedback who are bettr able to judge than me.
I was trying to work out rather than what cannot be said, rather what can be said. For this I would say:
Very HIgh confidence = that which has been verified by testing repeatedly
High confidence = that which has been verified by testing
Medium Confidence = That which has been tested and appears to be true
Low confidence = that which has little supporting data and/or largely found to be true but contrary data.
Very low confidence = theory or untested models.
No confidence at all = models that do not work
On this scale the ~1C from CO2 would be medium confidence as we have evidence it is true but cannot verify its effect in the atmosphere easily.
The models have failed, so at best “very low confidence”.
There may be some aspects of the modelling or theory that have been tested more, but otherwise all I know that can be said with any confidence is that doubling CO2 is likely to lead to around 1C warming.
Just an afterthought. The reason for the difference in confidence estimations is that the scale I suggest is for a complex system with a lot of unknowns – so the only way to gain confidence is by testing.
In contrast, the confidence scale you use, is based on simple systems where the system can be understood in its entirety and it’s behaviour predicted in its entirely by working from scientific principles.
But the atmosphere is demonstrably more complex than can be modelled simply from scientific principles. So confidence needs to be based on what can be shown to be true from test.
(It’s late I hope that makes sense)