Same warning as before – if you don’t love Fourier transforms, this is not the post for you.

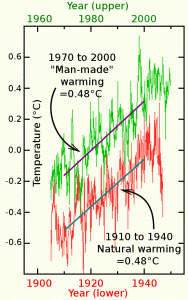
Comparison of warming from 1910-1940 with that of 1970-2000 showing exactly the same warming. The 1910-1940 is mainly natural variation showing the same scale of natural variation even if ALL the warming from 1970-2000 were manmade.
Recap
It is not possible to know was is abnormal, unless you first know what is normal. But when considering the 150 years of reasonable global climate data, this also covers much of the time of supposed “Mann-made” warming.
So, how do we know what is “normal”, from the same period as that we consider to be “abnormal”.
Time Division
The first approach is to divide the time arbitrarily between “early” and supposedly non-mann-made change and “late” which is supposedly mann-made. This leads to results similar to that shown on the right, whereby we see that the latter 20th century (1970-2000 assumed high mann-made warming) had precisely the same scale and duration of warming as the early 20th century (1910-1940 assumed low mann-made warming). In other words, no evidence that recent warming is unusual, which is presumably why this approach isn’t used – it doesn’t show a change in the fundamental behaviour of the climate from early to late period.
However, hard to pin them down, as the “compare arbitrary periods” is undoubtedly arbitrary.
So is there a more systematic test?

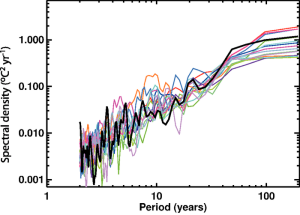
Fig 1: Variability of observed global mean temperature as a function of time-scale (°C2 yr–1)
from figure 9.7 IPCC (2007)
Fourier Transform Analysis
Yesterday in my post “What is a trend“, I stumbled across an interesting way to discriminate between mann-made and natural.
If we don’t know the amplitude of natural variation, we don’t know how much of any change is or isn’t natural. So, it is impossible to have any statistical test based on the scale of change. To put it simply: if we don’t know how big the signal (trend) would be normally, we don’t know whether what we see is much bigger than normal.
So, the amplitude of the signal provides no information of any use to determine the significance or otherwise of a change. In other words, those using supposed statistical “tests” based on the scale or gradient of change are talking out their backsides and I wish they’d stop (both sceptics and alarmists).
Phasors to stun
However, the same is not true regarding the phase of the temperature signal and the presumed mann-made warming. We don’t know the amplitude, but we do know that the signal “belongs” to a particular time period because CO2 started rising at a certain time. That means it has a fixed time relationship. In contrast, natural variation is assumed to be random, and so has a random time relationship. In frequency space (after a Fourier transform), this means the mann-made warming will have a deterministic phase, whereas the natural variation will be random.
So, if we compare the phases of frequencies in the presumed mann-made warming and the global temperature, the deterministic phases should correlate, whereas the random ones will not. Thus we have a means to discriminate even though we have no idea how big natural variation is.
It’s so simple (not)
So, in theory all I’ve got to do is check the correlation the two phases: the mann-made input and the climate signal and perhaps scale to ensure the most important (i.e. lowest frequencies) are weighted highest … or perhaps not?
What is important is the signal to noise. So, the weighting should be highest where the signal to noise is likely to be highest. So maybe, the weighting at each frequency should be the amplitude of the mann-made CO2 driver divided by the amplitude of the temperature signal. (or maybe squared or something??)
Because both mann-made CO2 and climate are likely to have similar profiles, I suspect this signal to noise will be relatively constant so as a first attempt, I could use a simple correlation with no weighting from 2years upward (1year being expected to dominated by yearly noise).
Correlation of Phasors
I suppose, the mathematical equivalence of correlation between two phases is the dot product of two unity vectors each at their respective angle. (or is it – what about if its more than 180degrees out – after 180 degrees as it its worse, two two get better!)
Equivalence of frequencies?
As the above chart of period against amplitude shows, the scale is not linear with time. If we plotted frequency, then there would be one frequency around the century, one around the half century, then another 8 frequencies up to the decade and around 90 frequencies between the decade and the year.
This is concerning, because being a 1/f type frequency plot, most of the “average” is occurring at the higher frequencies where we have least information.
My hunch is that we should be weighting toward the lower frequencies, but also, that the most discriminating frequencies for this test will be those around 20-30 year point. In other words, this test is really “can the phase of the 20-30 year components be explained by natural variation or do they coincide with the mann-made variation so that this must be at least part of the cause for them being there”.
I think I’m going to compromise – use everything from century to decade where I expect most information and discrimination, but have equal weighting.
CET
And finally, I think we can use this test on CET. CET is supposedly a mirror of global changes with added noise. The added noise is random, so the correlation with CO2 should come out as zero. So, if there is correlation, it should be solely mann-made (or statistical aberration).
CO2
Finally what CO2 to use? We’ve got good data from 1958. What I suggest doing is modelling this with an exponential curve which starts at a nominal value of CO2. Then I use the exponential for all time other than …
… but hang on, why not just use the period I have data and the frequencies it produces? If I use 1958-2014, I’ve got 56 years of CO2. If I use 2014 as the “base year”, I should be able to compare signal with signal at frequencies from 1/56 yrs-1 to 1/2 yrs-1 (or as I suggest 1/10 yrs-1)
Delayed response
Of course, there’s always a fly in the ointment. In this case, it’s delayed response. If the climate does not respond immediately to CO2, then there will be a phase change increasing with higher frequencies (proportional to the time delay).
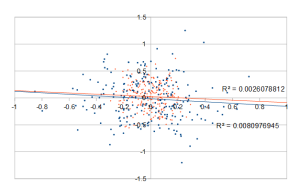
 So, maybe the test should be some form of linear regression (example right). I plot the correlation of phases against frequency, then do a linear regression and get the R thingy – and the R thingy will somehow translate into a meaningful statistic of how likely/unlikely it is that mann-made warming caused the temperature signal.
However, obviously phases can be uncorrelated by more than 360 degrees. So, as I’ve no idea how to do a linear regression on such a monster, the highest frequency considered must be such that 1/f > any delay – which might mean its a totally crap test because delays exist much greater than a century???????
But what matters is if the delay causes too much phase change – not whether there is any delay. It still seems worth trying – not that anyone will understand what the test means (and that might include me).
Need to mull over this
Still not convinced I’ve got the weighting right – so I will mull over this.

