I wrote this article on the basis that climate variability is 1/f noise and assumed that as red noise is similar to 1/f noise an upturn is as likely as a downturn. However, as I cleaned my teeth before bed I realised that was obviously wrong. Fortunately I had forgotten to publish, so I can correct myself. But first I will give the prediction I was intending to make based on the underlying natural variation (minus any CO2 warming) where warming is as likely as cooling:
Rather like predicting “rain” and always being right because sooner or later it will rain, in the same way the Met Office predict “Snow” without actually saying when it will arrive, it occurred to me today that I can predict a downturn in global temperatures with a 100% success rate.
Why is this? Simply put, the rise in CO2 will be adding slightly to the expected global temperature, but natural variation is much bigger than any man made influence. So, whilst the chance of the next trend is slightly higher for warming, there is also considerable chance that it will cool. And sooner or later it will cool, because that is just how the climate works.
So, I am predicting that cooling – and I’m writing this post so that when the down turn comes I can point everyone to this article and say “Look I told you so”.
 But now factor in the nature of 1/f Noise
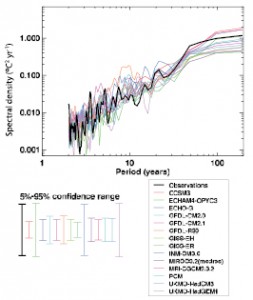
But now I can amend that prediction in the light of the nature of 1/f noise which as the almost straight line graph of climate variation with periodicity shows dominates the climate.
The key to understanding the statistics of 1/f noise was in understanding how one simulates 1/f noise by the sum of a number of noise sources; the number of which keep increasing each time the length of time doubles. As a result the variability just gets bigger and bigger.
I’ve been trying for a while to find “the statistics of 1/f noise” to find an authoritative statements on the statistical properties of this noise, but I suddenly realised, that if this is the way to simulate this type of noise, then there is an obvious limit to the noise in that the noise sources will add together as:
s12 + s22 + s32 …. + sn2 (where n increases by 1 each time the period doubles)
So, within any time period, the probability is just the addition of a lot of standard Gaussian like white noise sources. And I know their statistical properties! The type of noise which has an equal probability of a rise or a fall is red noise (random walk). But climate variation is not this type of noise. Yes, unlike white noise, Gaussian probability gets bigger and bigger, however, within a short time period if the present signal value is higher than the average, then there is more probability of a decline than a rise. And that is true in any period.
So, now I can say the following:
- If we ignore natural variation (as the IPCC do) we expect a rise in temperature due to rising CO2
- But because we’ve seen a sharp rise due MOSTLY to natural variation, this will undoubtedly on its own make a drop in global temperature likely.
So, which is more dominant? I’ve noticed with the climate that we tend to get around 0.1C of warming or cooling per decade. It’s too late to do the detailed maths, but clearly from my back of the envelope calculations, the warming we saw in the 20th century means we are close to the maximum one would expect from natural variation. Therefore, whilst I’m not sure of the exact probability, it’s fairly safe to say that:
cooling is significantly more likely than warming over the next decade.

