In previous articles I explained how the 1970-2000 warming was very likely caused by pollution reduction measures:
- Understanding Global Temperature VIII – It was the greens wot warmed us!!
- Understanding Global Temperature ix the role ofCO2
Today prompted by some comments on WUWT about the steady reducing value of “climate sensitivity” I wanted to point out how changing pollution levels explain this and the 1970s cooling.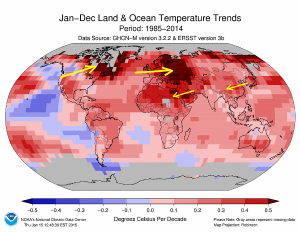
First to recap the main evidence. This map shows that the warming spots have been about 3-8days downwind of areas that were polluting heavily in the 1970s (Particularly Europe and US)
The 3-8days fits well with the time it takes for pollution to be washed out of the atmosphere by rain. Strongly implicating cloud formation in the process. In other words, pollution acted as a nuclei around which cloud droplets formed which then blocked sunlight.
1970s Cooling
Thus to explain the cooling that was seen in the 1970s and led to a massive scare, all we have to do is to show pollution levels rising up to a peak in the 1970s.
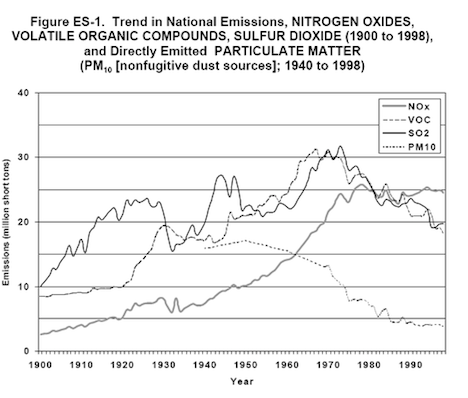
I think we have a very clear case of pollution rising to 1970s and then falling strongly. So yes it is capable of explaining the 1970s cooling. Note this will not be the only effect otherwise we would expect cooling from 1900 to 1950 and instead there was warming. So, this is at best a partial explanation of global temperatures.
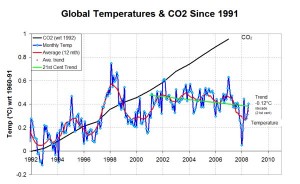
Global Temperatures & CO2
The Failure of the Theory of Manmade Global Warming
(As you will observe this is pretty ancient – it’s the first graph I published on climate).
The Pause
But what of the other famous feature of the climate: the pause. As shown right, the climate has doggedly refused to keep warming
In order to explain this using pollution we would heave to show a general reduction in pollution – then showing that that trend also slowed around 2000 (the timing may be off because 1998 was an El Nino which dominated the temperature for a few years).
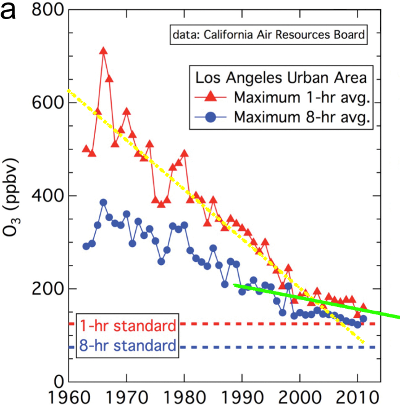 OK! It’s not quite “stopped”, but there certainly is a marked change in the rate of decline of pollution around 2000 (who was president?).
Overall Picture
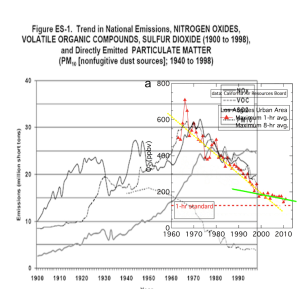
Now, lets see if we can get an overall picture of what has happened to pollution in the last century by combing what is admittedly very incompatible graphs (note the baselines do not match).
This shows that pollution levels rose from 1900 to a peak of 1970 and then dropped fairly rapidly until around 2000 when (at least some) had a sharp change in rate. (who was US president in 2000?)
Reducing CO2 sensitivity
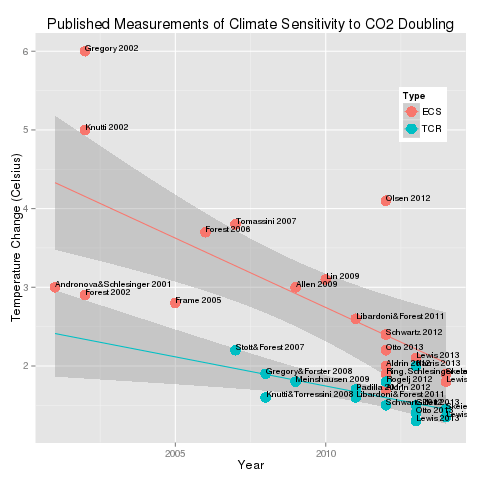
It has been noted for a while that since 2000 estimates of CO2 sensitivity have been falling:
 I know the researchers like to suggest that what they are doing is very complex and difficult for anyone to understand, but as there is nothing to base this on except the global temperature, all we really have is a figure of:
Sensitivity = total change per year / change predicted from CO2.
As the CO2 prediction is constrained by the one metric for CO2 and the fairly tight limits of predicted impact of CO2, the only real change between all these estimates is what temperature series they use and what baseline period they pick.
And the trend can be approximated as follows – using some very very rough figures for illustration only:
Trend = (1970-2000_trend *30 + 2000-present_trend * (now-2000) ) / (year- 1970)
Which if the 1970-2000 trend is ~0.15C/decade, the estimated CO2 effect is 0.05C/decade and we assume no warming since 2000 we get:
Trend = (0.15 * 30 + 0) / (year-1970)
And so CO2 sensitivity is
(0.15/0.05) * 30/(year-1970)
Thus we expect the following to be the average claimed CO2 sensitivity each year the pause continues:
| Year | “CO2 Sensitivity” |
| 2000 | 3 |
| 2005 | 2.6 |
| 2010 | 2.3 |
| 2015 | 2 |
| 2020 | 1.8 |
And this is what that very very rough illustrative trend looks like.
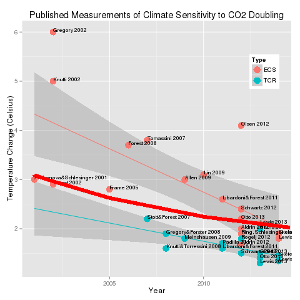 Yes! All we are seeing is the slow acceptance by researchers that there has been a pause and that they can no longer justify a massive increase in CO2 sensitivity by using the 1970-2000 “Environmental Action Induced Warming” (EAIW) to justify false ideas of massive positive feedbacks. Indeed, if anything their evidence was more flimsy than I gave them credit as it’s reduced faster than I suggested. Probably because the warming period was shorter than 30 years.


Pingback: CO2 92% incompatible with available evidence, 91% compatible with EAIW | Scottish Sceptic