In the last article I concluded that a reasonable proxy for global temperature could be produced using CET, then sea temperatures (HADSST3) then UAH6. However, that left me wondering why land based temperatures were so appalling. So, I decided to have a look at temperatures from 1980 onward which is when we see problems as the following shows: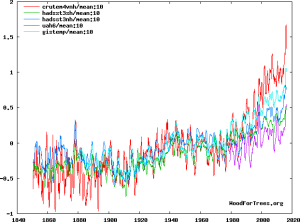 It didn’t take me long to work out what was going on. The following graph (all 12month smoothing) is produced by overlaying onto UAH6 a copy of HADSST 3offset by 0.21 with a copy of land based measurements (CRUTEM4) with a -0.22 offset PLUS a “detrend” of 0.6. (Which is equivalent to about 0.17C/decade of introduced warming)
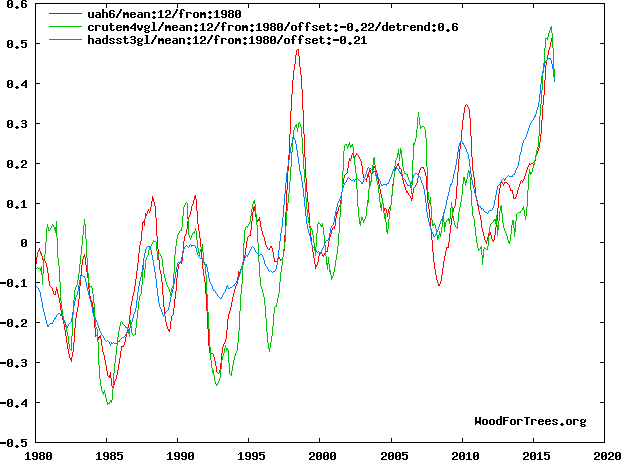 I think it’s safe to say, that they are all close to each other. But what is also important is that the sea surface measurements show less response: they tend to be cooler in years when the land & UAH is high and warmer in years when UAH/land is low. So what is happening to the land measurements? To highlight this, lets get rid of HADSST for a moment and look:
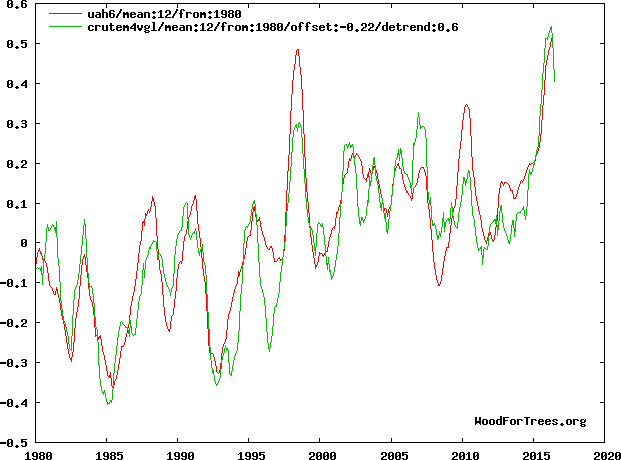 It’s difficult to see over which years one is higher than the other, so let me shade in the years when UAH is higher yellow and those where land based CRUTEM is lower blue.
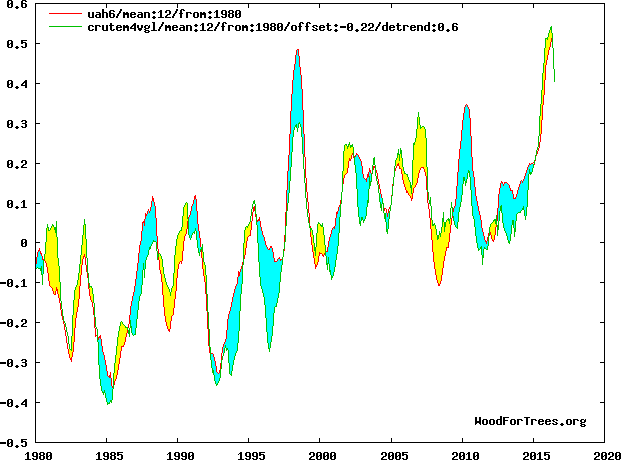 It seems to me that when CRUTEM land measurements are detrended, that not only are they a good match for UAH6 in terms of scale, but that there’s no obvious steps, nor would a second order equation with a curve produce a significantly better fit. My thought had been that this trend was a change in instrumentation since 1980, but I can not see any obvious cessation of the trend.
When did this Land based error start?
From the data, there is no reason to believe the systematic error on land based temperatures has stopped. However, we can assess it’s start. I used similar technique above and added a fixed linear trend to CRUTEM land based measurements and took the readings from 1940 (an arbitrary year). This is the result:
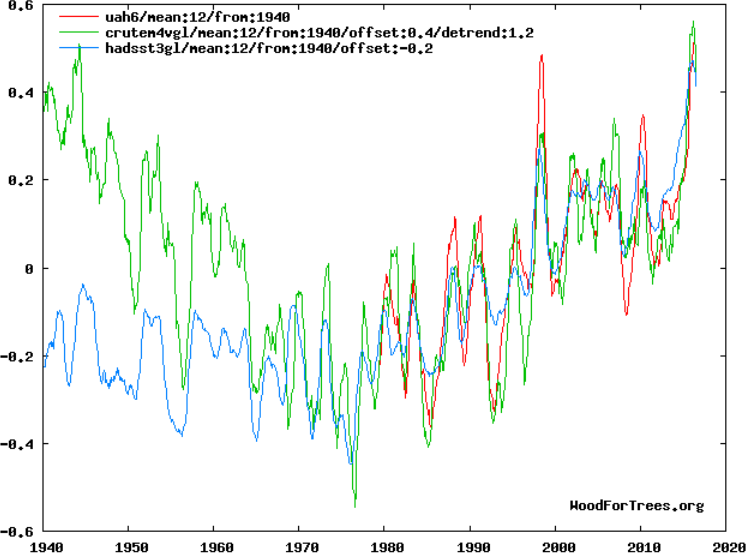 I think this is pretty near as close as I will get to conclusive proof that CRUTEM has some kind of linear error of about 0.17C/decade warming starting from approximately 1970
And if we now take away the land-based trend and align to match in the 1970s:
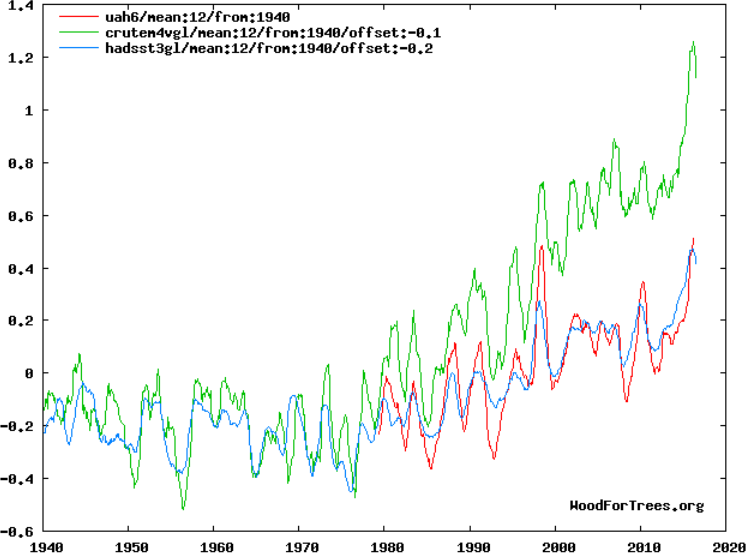 We find that CRUTEM (land) and HADSST (sea) are a good match before 1970. And, as we know, CRUTEM (land) goes bananas after 1970 and has a massive additional warming trend not seen in sea based measurements, nor satellites nor meteorological balloons. And three different sources agreeing and land based measurements disagreeing it’s clear that’s where we are getting an error in the global temperatures.
Conclusion
I’ve already concluded that sea surface measurements like HADSST (sea) provide the best indication of global temperature as would be shown by satellite measurements like UAH if they had been available (also similar to Met Office balloons). This analysis shows that there is a systematically increasing error in land data like CRUTEM from ~1970. I don’t know the cause, but I do know that the error appears to be linear and can be relatively easily removed by removing the trend from contaminated data.
My initial proposal was to use sea surface temperatures as a proxy for global temperature. But I now see that sea surface data lacks the “vibrancy” of global measurements like UAH. As such, whilst sea temperatures are the best proxy of global temperature for relatively long periods – and so can be used as such before the satellite era, sea temperature won’t be as good at showing the details for features like El Nino warming.
And whilst the long term trend of CRUTEM (land) clearly has a systematic error, the best match for the short term changes in UAH6, appears to be land based measurements like CRUTEM3.
I am therefore proposing the following (all data taken as yearly averages):
- That if no other dataset is available for a year I use CET
- Before 1970 I use CRUTEM 3.
- After 1970 I use HADSST3 for longer term changes over 5years.
- After 1970 I use CRUTEM4 for shorter term changes below 5 years.
- Where UAH6 is available I use this (or I may average with HADSST/CRUTEM as appropriate).


Pingback: Understanding Global Temperature IV | Scottish Sceptic
Pingback: Understanding Global Temperature VIII – It was the greens wot wamed us!! | Scottish Sceptic