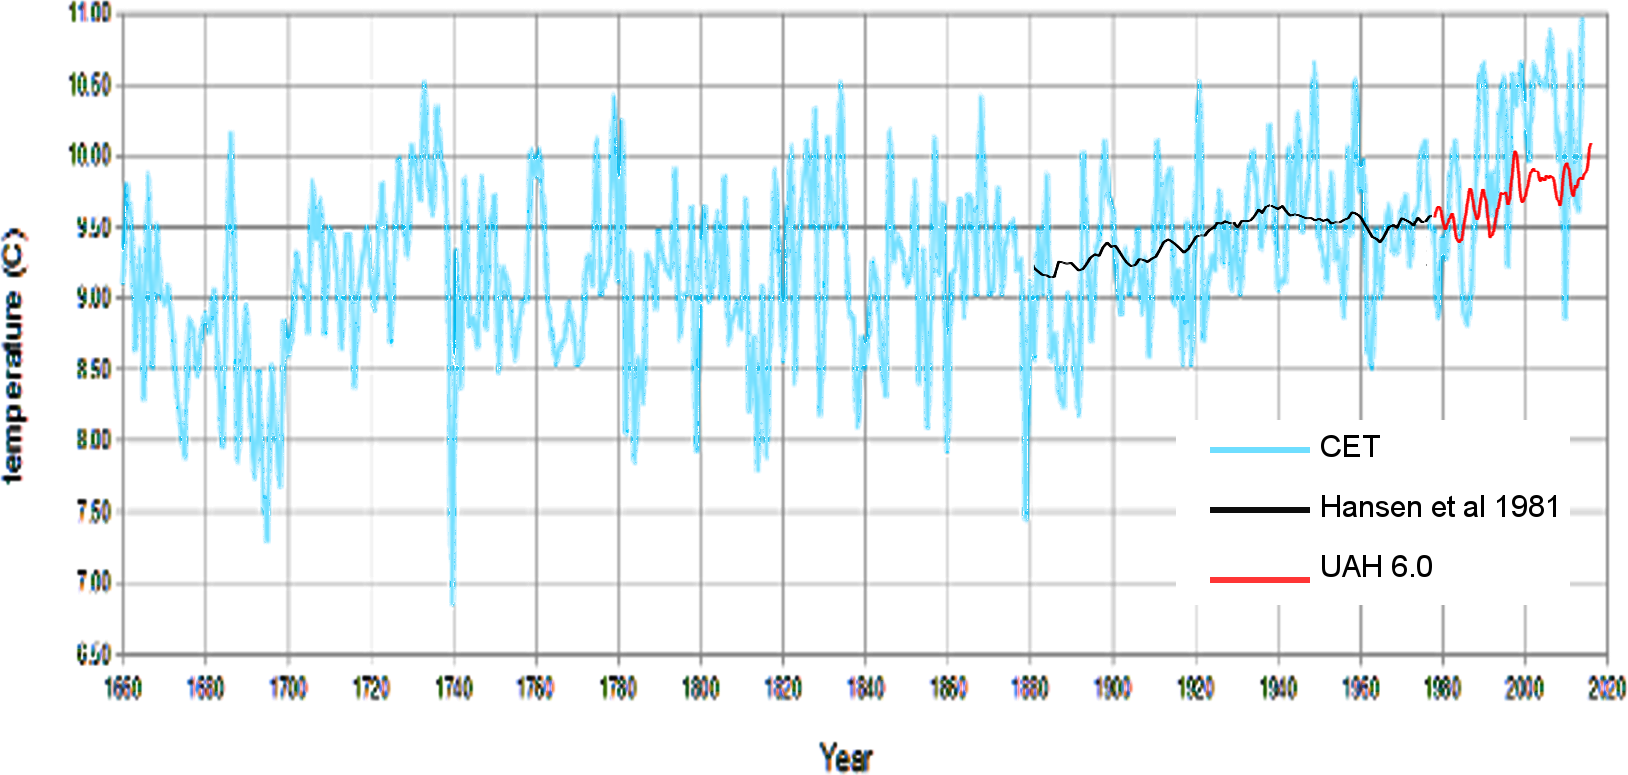
In my last post I created a reconstruction of global temperature over 350 years which I show below:
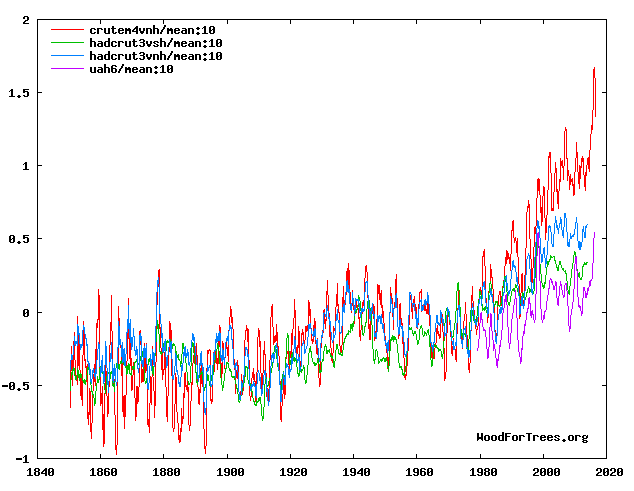
And as I said in the article, I was confused why the UAH 6 (red) had not warmed as much as the Central England Temperature (CET). I thought about it and it seemed to me that there was some factor affecting CET which in some way was being averaged out by the far more global UAH, which implied that some parts of the world were more like CET and had been warmer and some must have been a lot cooler so that the average overall was lower. At first I assumed this might be a northern-southern hemisphere. So, I played around with a few graphs on WoodForTrees.org and eventually produced this:
Here we can see that the actual global temperature from UAH is the lowest of the bunch, which is not that different from HADCRUT global south which is mostly ocean, next is Hadcrut north which is more land and the highest is CRUTEM north which is land only from the northern hemisphere.
If we now plot this back on the original CET graph we can see where the CET warming is coming from:
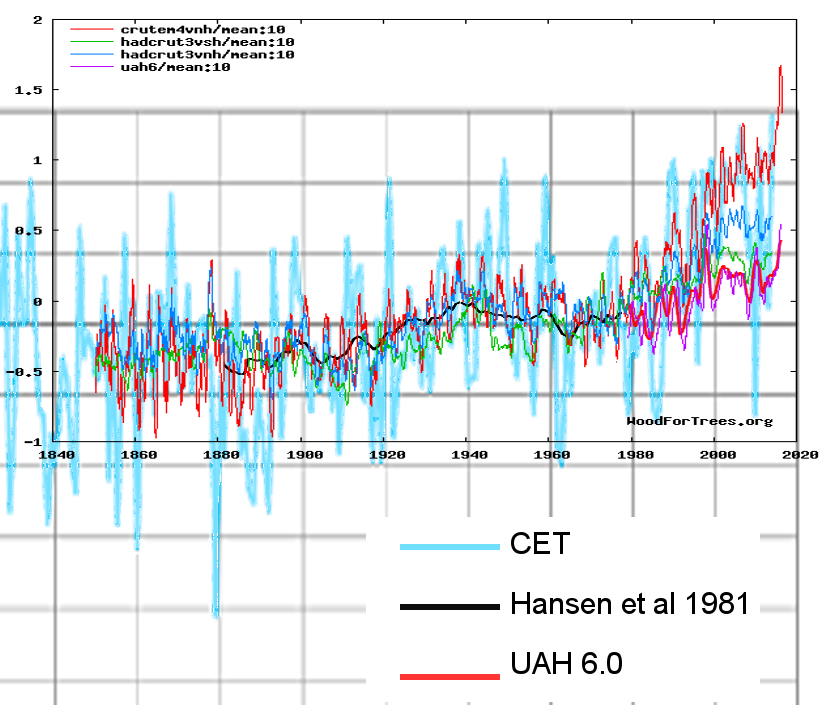 It’s very clear from this the discrepancy between CET and global satellite UAH is because it is northern hemisphere land. This also fits in with other evidence such as Arctic ice levels dropping whilst Antarctic increased.
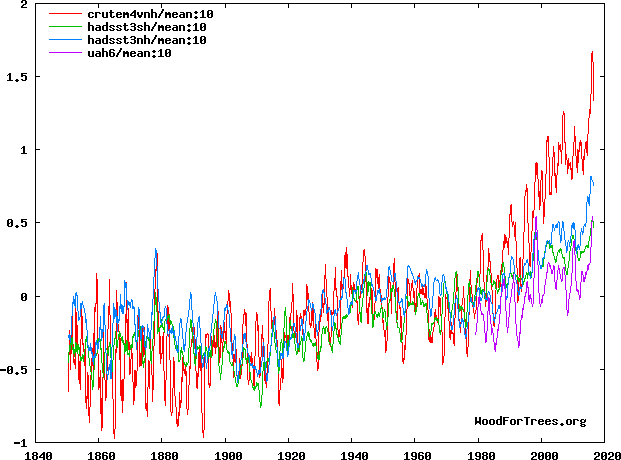
So, let’s take a closer look at what is happening at sea. Below are the sea temperatures for north (blue) & south (green) sandwiched between UAH (purple) at the bottom and CRUTEM Northern land temps (red) at the top:
 Now let’s take a peek at GISS and … where do you suppose they lie? See the pale blue lie higher than anything else except the land based northern hemisphere temperatures.
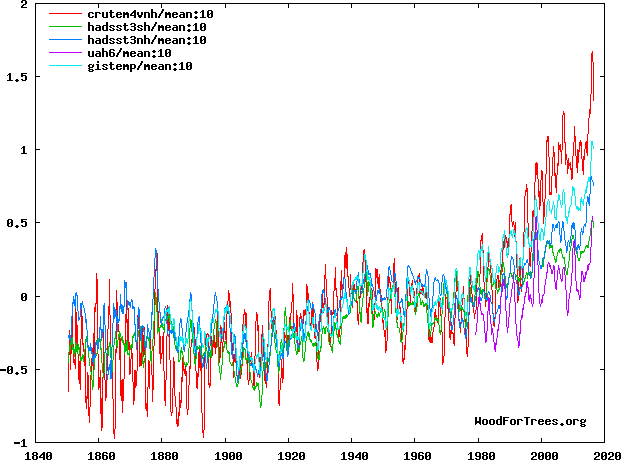 With every other series being lower than GISS, this tells me that the main discrepancy between GISS and the real global temperature shown in UAH comes from land based measurements. And in order for the landbased measurements to cause GISS to be much higher than the satellite average, it is necessary that GISS is recording from areas that are warming faster than most of the land. Why is this?
Of course I could just say it’s intentional, or Urban heating. But let’s for a moment ignore the obvious and look at this map of GISS temperature stations:-
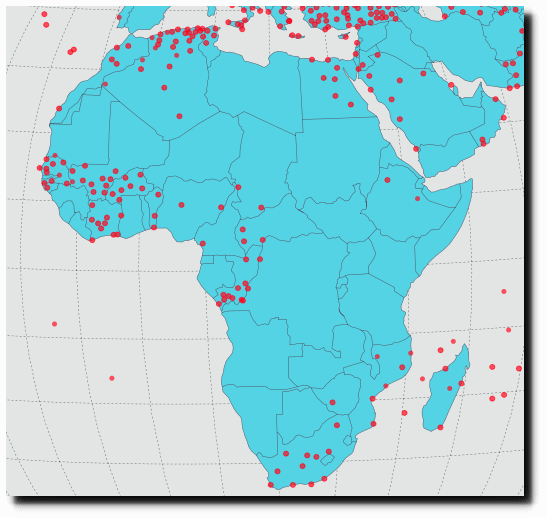
Very few a located in the centre of Africa and this lack of mid-continent sensors is repeated in other places like S.America (Grey means lack of sensors):
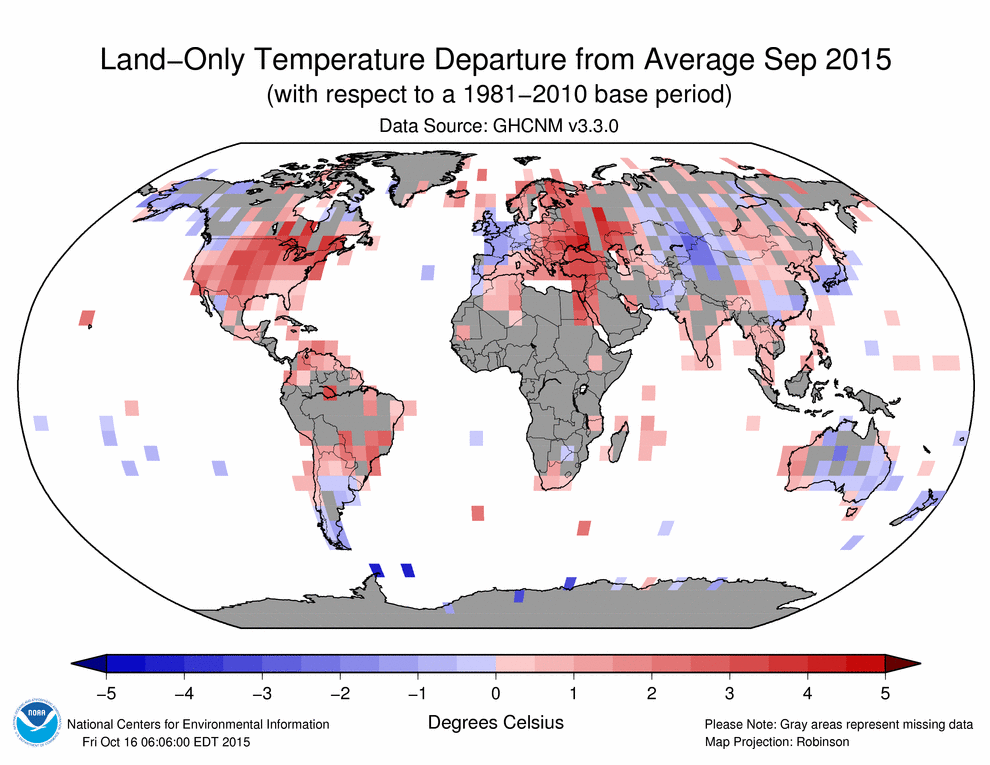 From this we can formulate a hypothesis:
The reason GISS is showing too high a temperature, is because the majority of its sensors are located near the coast where temperatures have been warming, which means that coastal warming must be balanced by central-continent cooling.
Coastal Warming
From the above and other information we have the following evidence:
- Coastal warming must be offset by mid-continent cooling (at least outside the poles)
- Greenland surface ice has been increasing
- Antarctic ice has been increasing
Thus it seems that in the last 20-30 years we have seen something that has caused coastal warming and mid-continent cooling (or at least cooler than coasts).
Usually, the sea is colder than the land and as such cooling winds move from the sea to the land and cool the coast. One way (not involving fraud and/or Urban heating) for the coastal areas to have warmed excessively, would be a drop in the intensity of winds that would normally cool the coasts.
This in turn suggests that inland continental areas are either:
- Becoming cloudier – perhaps because of pollution directly blocking sunlight or acting as cloud nuclei. (This would reduce wind speed and reduce temperature)
- That there is less moisture (because moist air rises. But this would mean inland temperatures would be warmer as evaporation is a major coolant.
Thus it is possible to suggest a further hypothesis (assuming we aren’t blaming Urban heating or fraud):
That something (e.g. pollution, dust or some other effect like solar activity) is increasing the level of cooling clouds in the centre of continents. This in turn is reducing the strength of on-shore breezes and leading to higher coastal temperatures. Thus coastal warming and inland cooling is leading to the over-reporting of global temperatures by land-based measurements which are predominantly on the coastal areas of continents.


Of course I could just say it’s intentional, or Urban heating. But let’s for a moment ignore the obvious and look at this map of GISS temperature stations
1. Ocean records for STT and Satillite records for SST are very close to each other.
2. Land records for SAT and Satellite records for “SAT” Show the most difference.
3. The difference is much larger AFTER satellites switched to AMSU, before this switch
satellites agreed with both land and ocean
4. Over land the greatest Difference is in Northern latitudes, specifically in those
regions where the land is frozen.
5. Satellite records depend on an assumption of constant emissivity of the land to
calculate the air temperature. If the area of frozen land is changing over the 1979-2016 period and if the microwave returns change as a result, then that assumption of constant emissivity is bogus.
6. GISS and other records do not have an over abundance of coastal stations. The main effect at the coast ( < 50km from the coast) is to narrow the diurnal range. They
dont warm or cool any differently than inland stations. Further in trend maps of the surface you dont see any coastal effects.
The map shows what I meant by coastal – as much as several hundred miles inland.
Satellites are corroborated by balloon data.
On emissivity: you can’t compare having no sensor with a small error due to emissivity.
Typical values are as follows: Material Emissivity Coefficient
– ε –
Water 0.993 – 0.998
Ice 0.98
Snow 0.969 – 0.997
Sand 0.949 – 0.962
Granite 0.898
Green Grass 0.975 – 0.986
So, the biggest change is from water to granite – the change from water to ice is very small.
Also, my father in law used to take temperature readings for the met office. He told be a story of another attendant who similarly was supposed top take readings. But he had a heart condition, and rather than go down the stairs and back – they would simply look at the sheet and fill in what they thought was the right temperature by going out onto the balcony. Similarly I have put up temperature sensors and seen the mess they are in when then come back. Between the human factor and animals, and insects and rain getting into the sensors and faulty sensors, and calibration and sunshine I wouldn’t trust them to a whole degree.
And given that they were never intended for the job – that there’s no quality control, that the whole attitude is entirely defensive and not once have I seen even the remotest concern for the quality of readings I KNOW FULL WELL THE SURFACE READINGS ARE CRAP. I’ve been in that position – I know what an appalling mess I would find it I went and checked what was actually going on.
And are you even aware that insects live in these meteorological stations – and unless you have someone regularly getting rid of them, they contaminate the readings. That’s fine when you have daily manual readings, but as soon as you got to automation, in come the insects and there is no one to remove them.
Likewise PT100/500 sensors are always going wrong. They need regular calibration and regular checking … that’s difficult enough when you’ve got a room full of sensors, but when you have to travel hundreds of miles into the bush to check them … well no one is going to bother for a fraction of a degree error.
Pingback: Understanding the Global Temperature II | Scottish Sceptic
Pingback: Understanding Global Temperature VIII – It was the greens wot wamed us!! | Scottish Sceptic