[Note: This post reports confirmation that the theory I presented a while back on tectonic plate movement has been confirmed and is sound science. However, given the deafening silence I will make it sticky for a while.]
Back in 2015 when I first published the Caterpillar Theory on this blog (Overview), I was taking a gamble putting together almost “anecdotal” evidence from the shape of the ice-age curve and the simple physics of thermal expansion. I took a gamble and now it seems very clear I was right!!
The theory predicted two basic phenomenon:
- That during colder period of the ice-age cycle, the cooling earth would contract and mid-oceanic ridges would open up allowing magma to flow up and cause plate formation. Thus this plate formation would be modulated by the ice-age cycle
- That during the warming phase, heated crust would expand, and where plates met at subduction zones, one plate would be forced down. The lowest parts would be pushed down to a depth where they would thermally decompose, the volatile components like H2O, CO2, sulphur, etc. would be released, find their way to the surface and be released increasing the level of volcanic emissions.
The first prediction was confirmed almost as soon as I published in a paper by Maya Tolstoy (Link) the following graph is a redrawing of fig 3 and shows a correlation between mid-ocean sea floor spreading and Temperature (where CO2 is a proxy for temperature).

Fig XX Bathymetric and ice-age cycle (CO2) data normalized to a aximum amplitude of 1, and
superimposed
I don’t deny this is not a perfect correlation, nor that the author mistakenly put the causation the wrong way around: mid oceanic ridge formation caused CO2 levels to change, rather than understanding that the modulation in mid oceanic ridge formation was caused by temperature (which is closely linked to CO2 levels).
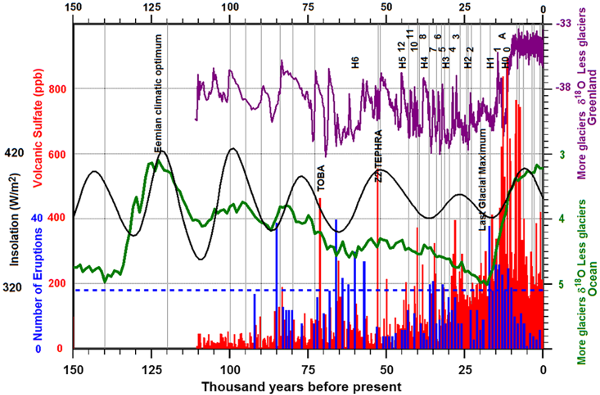
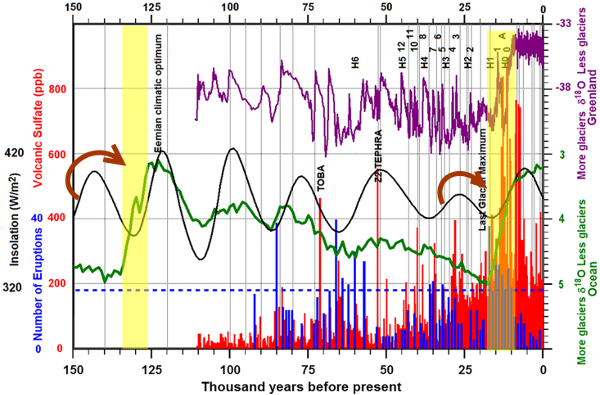
However, now I have come across another graph which I think is far more compelling. This is from Lund et al (2016) (Thanks to Ned Nikolov) As I predicted it clearly shows an increase in volcanic activity (blue=number of eruptions, red=Volcanic sulphate) during the warming phase (Green and top purple is number of glaciers):
 With two separate confirmations of the theory, it is safe to say the theory has proven its worth and is capable of predicting what actually happens on/in our planet. (Note I’ve still to check the source and validity of the above graph)
Overview of Caterpillar Effect
Warming
When the crust warms such as during the current interglacial, it expands, and as this increases sidewards pressure, one tectonic plate is forced down beneath its neighbour causing subduction of mantel material. This material is then superheated (or at least it pushes a whole section down of which the deepest part reaches a critical temperature) and then it is thermally decomposed. The various decomposed element (H2O, CO2, Sulphates and light rocks) then make their way to vents to the surface where they are expelled in volcanic eruptions.
 Cooling
In contrast, cooling causes contraction which causes the tectonic plates to pull away from each other. But because the plates overlay each other at the subduction zones and are vertical at the mid oceanic ridges, in the cooling phase, they pull apart at the mid-oceanic ridge and we get old magma expelled (i.e. with few products from subduction thermal decomposition). So in the cooling phase we get relatively quiet mid-ocean ridge expansion and ridge building.

The Caterpillar Effect
The reason it is called the Caterpillar effect is because there is a kind of ratchet effect, in that the magma at the mid-oceanic ridge fills the gap. So, in the next warming phase, the crust cannot just expand back to where it was. Instead it is force in one direction toward the subduction zones. But the plate moves in the way of some caterpillars.
Thus the Caterpillar effect is the movement of the plate in response to periodic changes in surface temperature such as that over an ice-age cycle.
The Milankovitch Trigger
It has long been recognised that there is some kind of link between the Milankovitch cycle and the ice-age, because the ice-age warming seems to coincide with some, but by no means all, Milankovitch cycles. The Milnkovitch cycle is a long term change in the intensity of heating of the sun at the surface of the earth due to changes in the earth’s orbit around the sun. It is shown in black in the graph below.
 And it was this relationship which was key to my initial proposal for the Caterpillar effect, because I realised that the ice-age cycle could only be explained by some kind of delay in the planet. And I found this in the great time it took for changes at the earth’s surface to penetrate the crust.
The question then was how the Caterpillar effect relates to Milankovitch. Because the Milankovitch effect is a relatively small change.
The way it triggers is as follows:
In the cooling phase, the crust at first cools relatively rapidly, but after a time it starts to stabilise in temperature and the rate of cooling slows.This also means that contraction of the crust when cooling starts is fairly rapid, and as a result there is a dramatic reduction in volcanic activity and increase in mid-oceanic plate formation.
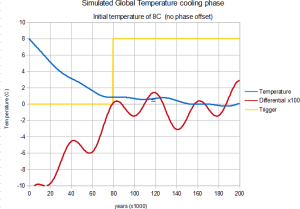
As the graph below shows, the temperature (blue) of the crust at first cools rapidly, but on top of this cooling there is a small modulation due to the periodic changes to solar heating over the Milankovitch cycle. In order to see the critical point, I’ve taken the rate of change of temperature, scaled it up and shown it in red:

At first the rate of change (red) is negative indicating continuous cooling. But as the rate of cooling from the ice-age cycle slows down, eventually the warming from a Milankovitch period of increased insolation (solar heating) becomes just great enough to tip the crust into a small amount of warming.
It is then hypothesised, that whilst small, this warming triggers subduction processes which in turn cause a release of gas – which in turn leads to planetary warming, which in turn leads to crust expansion, which in turn leads to further subduction and release of gas, causing a run-away warming process.
One problem, however as shown by the above graph, is that the ice-age to interglacial warming occurs at a point when the Milankovitch cycle is cooling (in the graph in black). Whereas we ought to see the trigger occur around 15,000 years earlier at the peak of Milankovitch warming.
But this can be easily explained by the delay for surface heating to penetrate the crust. This is shown in the following graph which shows the calculated temperature profile in basaltic rock (depth along x-axis). This shows the profile of a sinusoidal +4/-4C heating/cooling graph plotted every 30degrees or ~10,000 years. When the surface is at the highest (+4C) temperature (dark blue line), if we follow this down, we see that the crust around 4km deep is at its coldest point in the cycle. This shows at that depth there is a 180degree phase shift: when the surface is warming – at 4km it is getting colder and when the surface is cooling, at this depth the crust is getting warmer. In other words, not only is the scale of warming and cooling smaller, but it is ~56kyr behind what is happening at the surface.

So looking at the graph it is possible to see it takes roughly 15,000 years for heating to penetrate around 1km deep. (56kyr/4km = 14kyr/km) This suggests the critical depth at which the caterpillar effect operates is around 1km.
Positive Feedbacks
What I do not propose to outline here is the exact form of positive feedbacks. This is partly because I am still working on this area, but also as it is generally agreed by the scientific community that there must be positive feedbacks present in the ice-age warming I don’t think this part of the theory is at all contentious. As such, it is not necessary to say exactly what positive feedbacks are present in order for this theory to acceptable to the scientific community.
But I do wish to comment on the possibility of CO2 causing the warming. Whereas CO2 will undoubtedly cause some warming, the fact that there is short-term warming and cooling that do coincides with changes in CO2 at other parts of the ice-age cycle other than the first dramatic warming, shows that it is clearly not the only thing causing warming. There must be other effects present other than CO2. For example, we know the ice-ages are drier, and we know the interglacial is warmer, and we know that H2O is released in huge quantities during volcanic eruptions and H2O is a potent greenhouse gas in the atmosphere. So CO2 is not the only potent greenhouse gas released in eruptions. And I can also say unequivocally that CO2 is not the prime cause of warming due to the lack of correlation over the total ice-age cycle.
The Hard-Stop to warming
However, what is missing from most other descriptions of the ice-age cycle is an explanation as to how the warming stops. This is a major failing of almost all other proposals. To explain, each time the planet warms from an interglacial, it comes to a stop within a very narrow band of temperatures:

What this means to anyone who understand feedback mechanisms, is that there is a non-linearity in the feedback mechanisms at this “level” (temperature), such that there’s a “hard stop” so that (within normal limits) it cannot warm further.
In other words, whilst the warming from the interglacial seems extremely likely to be the result of the positive feedbacks, if we didn’t have the “hard stop”, once the climate started warming, it would just keep warming and warming and warming (in the vicious cycle of “catestrophic warming” so beloved by the press) and so the very first time such warming occurred without the hard-stop, the warming would have continued until the earth was a fiery lump!
So, the positive feedbacks that are almost certainly present when we come out of an ice-age, either disappear & come to nought at our interglacial temperature, or some strong negative feedback appears, OR BOTH!
By chance I recently came across an article on WUWT which I think confirms what I have suspected for a while. This hard stop comes from low level clouds:
Claim: climate feedback is low due to clouds “impeding global warming”
In response to increased carbon dioxide, climate models predict a nearly uniform warming of the planet that favors reductions in highly reflective low clouds and a positive feedback. In contrast, over the last 30 years, tropical surface temperatures have increased in regions where air ascends and decreased where air descends. “This particular pattern of warming is nearly optimal for enhancing low cloud coverage because it increases low-level atmospheric stability that keeps the lower atmosphere moist and cloudy”, said Stephen Klein, the third co-author.
This research is important, because it indicates the mechanism that creates the “hard stop”. To put it simply, as the world warms, the air becomes moist, and that moisture rises and forms clouds. And then these clouds block out the sun preventing further warming. It’s that simple. And the reason we don’t get this effect in the ice-ages is because the world is a lot drier.
The relationship of this theory to Global warming & CO2
What I’d like to finally comment on is the relationship between what I am proposing and the theory of “Global Warming” (or catastrophic manmade global warming to use a fuller description)
The Caterpillar theory (i.e. crust expansion and contraction) is now very well substantiated by the evidence and is far better supported than the theory of human-caused global warming. However, this is but a part of the larger theory I am building which is a complete theory of the ice-age cycle.
As both my theory and that of “global warming” rely to some extent on greenhouse gases I would like to explain the main difference:
Whereas the theory of “global warming”predicts that there will be large scale positive feedbacks always present, so a small change in CO2 will lead to further “catastrophic warming”, my ice-age theory says that there is a “hard-shop” in the cycle so that further warming in an inter-glacial period such as the present is extremely difficult. In other words, even a substantial increase of CO2 in the atmosphere, will cause modest warming at best and certainly not “runaway warming”.
Thus, although both theories suggest that CO2 is an important in causing warming, I suggest that any warming effect of rising CO2 strongly reduces in the inter-glacial, whereas the “global warming” theorists say the effect of a small change in CO2 should always lead to massive warming (about 0.3C warming in the last 20 years). In reality the best temperature sensors (the satellites) show no significant warming for the last 19 years. This is consistent with my own theory. But it is inconsistent with the theory of “Global Warming”, showing the global warming theory is at best “unvalidated” and at worst just wrong.
However, I also propose additional feedback mechanisms. So, not only is the warming from rising CO2 stopped by the “hard stop”, but in my model, the net effect of changing CO2 will be much smaller than in the “Global Warming” theory.


Pingback: Massive Volcanic eruptions with clouds of sulphur gas caused runaway heating that ended ice-age claims Independent Scientist. | Scottish Sceptic
Re. crust expansion: ‘Large earth crack forms in Pakistan’s Balochistan’
‘The fissure apparently spans several hundred miles, sparking panic among local residents.’
http://watchers.news/2017/02/10/large-earth-crack-pakistan-february-2017/
Thanks!
I made the bland assertion that “expansion can cause up to a few km of movement over the circumference of the earth (40,000km), what I didn’t say is that unlike a flat plain where you’d get a single joint moving together or apart, the spherical surface of the earth means you get a very complex pattern of expansion and contraction.
What makes it even worse, is that the expansion and contraction moves down into the earth in a “wave”. And that different rocks have different coefficients of expansion.
When people start realising just how huge this effect is, then we’re going to get tonnes of papers written about it.
‘Large earth crack forms’ – not so ‘rock solid’ science then 😉
Thanks Oldbrew – thinking how to reply – it occurred to me that understanding this effect may help understand how certain minerals form and therefore may help locate them.
How do you exclude an increase in volcanic activity due to the reduce pressure from melting glaciers? How does the earth recognise the tiny warming from above from the massive warming from below?
Those are two excellent questions.
On the issue of glaciers, we would certainly expect & get earthquakes as the magma moved under the crust (I have a vision of a water bed made of treacle and covered with papadums – if you lay still, the bed would slowly sink – which regular cracks from the papadums. Getting up would slowly revere the process). For example there are reports of small earthquakes at the Oroville dam.
I quickly looked for Antarctic volcanos none of them are given as erupting during the last ice-age and many are during the inter-glacial. That however could be because you can tell if they haven’t been covered by ice – but if they have, you can’t tell how many ice-ages have covered them.
On the massive warming from below. We’ve very little information on the relative heat under the surface, let alone the change with time. Also, the coldest part of the crust will be “stiffest” – and that is much nearer the surface than the magma. It all depends on the relative changes of heat that is occurring.
Indeed, you could have very complex cycles: Heating causing subduction, causing melting causing “rivers” of magma beneath the crust, which … may be cooler than the magma creating a “pool” of cool magma (remember it will be upside down).
However, whatever the details both are interesting points.
Tiny, the answer came to me this morning re “How does the earth recognise the tiny warming from above from the massive warming from below?” … and it’s that because the atmosphere circulates that a (long-term) change is always global. So, the temperature change is over a 40,000km distance. Whereas, I don’t think anyone’s suggesting the magma redistributes heat around the globe. If there is a temperature change, it seems likely to come from a hot spot developing under the crust, the temperature change may be … I guess 1000C, but it’s over perhaps 100km and millions of years. That will cause a localised expansion/contraction, but not a global wide one. So 5C x 40,0000/100,000yrs = 2 C.km/yr whereas 1000C x 100km/1million = 0.1 C.km/yr
But there are multiple hots spots. So just 20, would (using my very very rough guestimates) would be equivalent.
But the “rigid” crust will be that which is close to the surface …
Would you expect to sea an annual variation?
I’m of the opinion that the missing piece is not on Earth at all but the sun. I think it does stuff that we haven’t seen, never mind measured.
Annual expansion and contraction of rock is well known and that was the focus of the original paper from which I drew the equations of heat transport through rock. However the depth is relatively small at a couple of metres. Because of the low rock pressure – expansion in the rock tends to lead to lifting up and fracturing of the rock (the reason high mountain crags are craggy)
A similar effect is found on ice where you get pressure ridges developing: http://scottishsceptic.co.uk/wp-content/uploads/2015/02/ice_PressRidge.jpg
These can develop due to daily changes in temperature.
Here, the ice is very level, and so it can create a very stable flat layer on top of the water. Now, when the ice expands, it pushes straight outwards along the layer and when a lake is several miles across, the pressures grow enough to break the ice and cause a pressure ridge.
In other words – almost to the same shape, the pressure ridge is what we find in the mid-oceanic ridges: repeated expansion of rock floating on the magma and where they come together we get something like the “jumble of ice lumps”.
What you also get is cracks in the ice – which expand at night and then refreeze
Here’s one image: https://cdn.theatlantic.com/assets/media/img/photo/2016/11/2016-national-geographic-nature-pho/n24_1965729203315/main_900.jpg?1478105410
You can see the progressive bands here – presumably from each day/night cycle, such that the ice gradually creeps away from these expansion cracks and builds up ice-ridges.
And here’s a whole paper: http://www.physics.otago.ac.nz/research/ice/publications/ChrisPetrich_PhDThesis.pdf
And note, that everything I’m proposing is already found in nature, and that there’s very little that is either new or controversial.
Tiny – in case you don’t see it, I’ve written a more detailed article on the formation of ice pressure ridges:
http://scottishsceptic.co.uk/2017/02/21/the-caterpillar-effect-on-ice-pressure-ridges-and-refrozen-cracks/
Pingback: The Caterpillar Effect on ice – pressure ridges and refrozen cracks | Scottish Sceptic