The Science

After a recent comment I realised that it isn’t possible to include all the science in each article and that I’m going to have to provide some kind of prima for those who don’t yet understand important details of the science.
As such I’ve changed the menus around and have created links to the following:

  • GreenHouse Effect
    This is an important article because I’ve yet to see anyone who explains the greenhouse effect properly. What is worse, some of what you’ll find even from some academics is complete trash.
  • Lapse Rate
    Important only in that the lapse rate is key to the Greenhouse effect so it’s good to understand what it derives from
  • Introduction to 1/f climate noise
    An introduction to 1/f noise – the kind of noise seen in the climate signal
  • Natural habitats of 1/f noise errors.
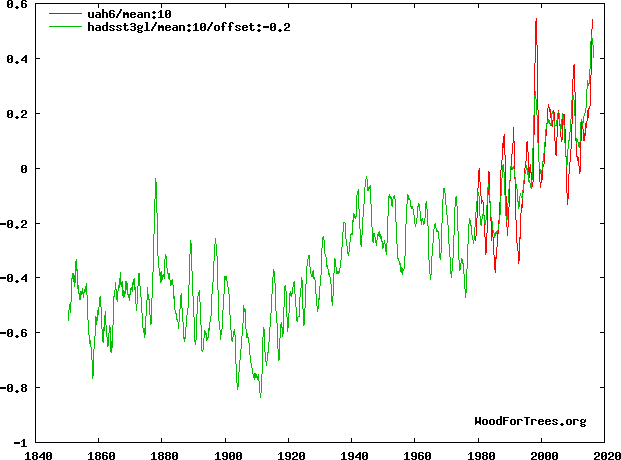
    An illustration of the typical errors people get into when assessing 1/f type noise
  • Assessing recent temperature trends for abnormality
    The only way to assess something like climate where we have no idea of what is “normal” to assess what is abnormal, is to look at changes within the same signal. I show how the rate of change over various periods can be predicted, and how this can be used to assess recent temperature changes.

If there is anything missing please say so in the comments.

Posted in Climate | Comments Off on The Science

Revised Temperature prediction

Following my series on Understanding the global temperature. I have realised that it is likely that a substantial part of recent warming – particularly northern hemisphere land-based temperatures have risen due to air plane contrails.
Thus for forecast I made a while back: My Global Temperature Forecast: cooling ~0.35C by 2030 years would need to be revised upward. Also having examined temperature records, I think the effect of the Atlantic oscillation is smaller than I suggested.
This is a “finger in the air” forecast because much of what I’m using is very poorly understood so use it at your own risk.
Direct CO2 warming is probably of the order of 0.05C/decade. The contrail warming is hard to quantify as it is so regional, but globally met balloons show a ground based trend of around 0.13/decade. The northern extra tropical regions is warming at 0.2C/decade faster than the southern area. If we assume this is due to contrail formation, this suggests very roughly around 0.1C/decade global warming due to increased air traffic and contrail formation.
Temperature rise from 1970-2000 as measured by HADCRUT was around 0.48C or 0.16C/decade. Meteorologically balloons indicate slightly lower warming globally of 0.14/decade since 1970.
We now have the following that suggest change:

  • Rising CO2 – causing perhaps 0.05C decade
  • Rising Contrails – which measured globally is of the order of 0.1C/decade
  • Possible negative phase of Atlantic Multidecadal Oscillation which at most is suggested at 0.1C cooling. But a lower figure is more likely (0.05C?)
  • Reduced solar activity. If contrails account for significant warming since 1970, then I estimate about 0.1C/decade cooling. (I’m using the suggested discrepancy from the graph below and suggesting half is caused by contrails). The forecast of this is difficult as who knows whether solar activity will remain low.

Forecast

Based on this, my best estimate of global temperature change is from no change to perhaps 0.1C warming in the next decade. However, there is significant natural variation of around 0.8C so the forecast would need to be 0.1 ±0.8C in the next decade.
Based on what I know of climate, and the likelihood of negative feedbacks, I would suggest a best long term estimate of perhaps 0.8 warming by 2100.  Again there is significant natural variation of around 0.5C & I have no real idea of the scale of negative feedback so my best forecast would be something like 0.8±1C
This figure however relies on continued increase in contrails and no diminishing impact as the skies are filled with them. If however we find a way to reduce contrails, that figure will be substantially lower, but if the rate of filling the skies with contrails increases it could be higher.

In Perspective

To put this forecast in perspective here is a plot of daily temperatures in Boston. The day to day temperatures change considerably. Over the month the mean temperature also changes significantly. The total change due to global warming is entirely contained within the red line.
GlobalWarmingInPrespective

Posted in Climate | Comments Off on Revised Temperature prediction

Understanding the Global Temperature V – Met Balloon Data

Note: the comments on height and the greenhouse effect are not accurate. Please see next article for a better description

Summary so far

In previous articles, I have tried to work out to what extent I can produce a global temperature which is free from the “thumb on the scales” as Dr Bates referred to NOAA’s own attempts to get rid of the global temperature pause. There are also indications that NASA have been trying to get rid of the 1970s cooling.
I am reasonably confident that the satellite data is the best available global temperature we have. This is because it is the only sensor where we have a known quality standard and traceability of calibration back to recognised standards. In contrast, from my own experience, I know that ground sensors have huge problems, and there is a complete lack of quality control which would make even a chocolate chip manufacturer squirm.
So, far I have identified an apparent yearly increase in land surface temperature apparently starting in 1970. I have proposed a way to remove this and was at the stage of comparing my proposed solution with available temperature sets when I went to look at Meteorological balloons.

Meteorological Balloons

I downloaded the data from NOAA  and produced this.RadioSonde1
Something is very odd with this. All the layers above 300mb (9km) are cooling and the higher ones most and the lower layers are warming. Could this be the signature of global warming? According to the Noddy theory of global warming, CO2 traps IR, so this, Noddy researchers might conclude is the signature of greenhouse gases: the heat is trapped in the bottom of the atmosphere and so there’s no heat for the top. Continue reading

Posted in Climate | 8 Comments

Understanding Global Temperature IV

Following the last post  I had a go to see what the graph might look like. With a bit of added processing to CET to give it a similar dynamic to the other global temperature proxy datasets, I produced the following curves which are overlaid here:
Reconstruction16
And in one continuous sequence here:
Reconstruction15

Posted in Climate | 2 Comments

Understanding the Global Temperature III

In the last article I concluded that a reasonable proxy for global temperature could be produced using CET, then sea temperatures (HADSST3) then UAH6. However, that left me wondering why land based temperatures were so appalling. So, I decided to have a look at temperatures from 1980 onward which is when we see problems as the following shows:Reconstruction5It didn’t take me long to work out what was going on. The following graph (all 12month smoothing) is produced by overlaying onto UAH6 a copy of HADSST 3offset by 0.21 with a copy of land based measurements (CRUTEM4) with a -0.22 offset PLUS a “detrend” of 0.6. (Which is equivalent to about 0.17C/decade of introduced warming)
Reconstruction11I think it’s safe to say, that they are all close to each other. Continue reading

Posted in Climate | 2 Comments

Senator Inhofe retiring in 2020

Inhofe_snowballI was planning to write today about a superb piece by Coral Davenport of the New York Times which has run a few intelligent articles on climate and the environment lately:

Head Stacks Agency With Climate Change Skeptics

However, for me the most interesting part was close to the end:

Mr. Inhofe, 82, will complete his current Senate term in 2020. While he declined to speak of his retirement plans, Mr. Inhofe said of Mr. Pruitt, “I think he’d make a great senator.”

I will say very firmly that there are few politicians I admire as I think we are poorly served by most. However there are a few notable exceptions and Inhofe is one. Yes there are always back room guys who do the actual work like Mark Morano and others, but as I like to put it: “you always need a fairy to put on top of the tree”. And Inhofe was the guy who became the key politician, at a time of immense and systematic hostility, who was willing to speak up for common sense on climate.
Any politician can get behind a cause which is widely respected and liked. But few have the guts to stand up for what they know to be right at a time when every other politician is going with the crowd the other way. But Inhofe stood up to be counted at a key time and in doing so he was widely vilified and the target of much public hate. That takes guts for a politician.
Once Inhofe was one of the key politicians constantly in the climate news. But since Trump, I’ve noticed that Inhofe’s name has been missing and I was even wondering what had happened to him …. now perhaps we know? Has he has metaphorically handed the snowball onto a younger generation?

Thanks for all you’ve done Inhofe.

Posted in Climate | 3 Comments

Petition: Abolish House of Lords & replace with a people's assembly

Following the behaviour of the Lords & many politicians in trying to thwart the will of the British people over Brexit, they have shown they cannot be trusted with our democracy. The House of Lords should be scrapped and replaced by an apolitical body such as a citizens assembly.
The exact nature of the citizen’s assembly is not as important as that the upper house should be largely free of the self-serving career politicians and bought peerages who have have recently shown so much contempt for the will of the people. Several options are possible including an assembly selected like a jury from volunteers or one appointed by a similar citizen’s panel where members are chosen for the character not their political colour.

Posted in Climate | 3 Comments

Understanding the Global Temperature II

Recap: in the last article, I showed that the satellite record, which is our most reliable indication of global temperatures, is most like the sea temperature record and least like the land based record. I had a go at trying to suggest a possible physical cause (other that data manipulation and/or rural heating), but as the aim is to create my own long term temperature series it does suggest a way forward.
Below is a plot of global sea temperatures HADSST3 and UAH6 with a 0.2C offset to UAH6
Reconstruction8
I think you’ll agree that is a remarkable fit. Which means that my best estimate of what a series like UAH6 would show in the past is HASSST3. So, now rather than relying on Hansen et al 1981 which is using known biased source I can create a long term series from HADSST:
Reconstruction9Not only is HADSST3 a good fit to CET, but having decided that HADSST (which is almost identical to UAH6) is our best proxy for global temperature it is great to find that CET appears to be a better fit to HADSST than Hansen et al 1981.  In other words it appears I am quite justified in ditching Hansen altogether. Continue reading

Posted in Climate | 5 Comments

Understanding the Global Temperature "discrepancies"

In my last post I created a reconstruction of global temperature over 350 years which I show below:

Reconstruction of Global Temperature using CET, Hansen et al 1981 and UAH6

Reconstruction of Global Temperature using CET, Hansen et al 1981 and UAH6


And as I said in the article, I was confused why the UAH 6 (red) had not warmed as much as the Central England Temperature (CET). I thought about it and it seemed to me that there was some factor affecting CET which in some way was being averaged out by the far more global UAH, which implied that some parts of the world were more like CET and had been warmer and some must have been a lot cooler so that the average overall was lower. At first I assumed this might be a northern-southern hemisphere. So, I played around with a few graphs on WoodForTrees.org and eventually produced this:
WFT1

Crutem (Land) N; HADCRUT global N & S; UAH


Here we can see that the actual global temperature from UAH is the lowest of the bunch, which is not that different from HADCRUT global south which is mostly ocean, next is Hadcrut north which is more land and the highest is CRUTEM north which is land only from the northern hemisphere. Continue reading

Posted in Climate | 4 Comments

Temperature Reconstruction

Recently there’s been a couple of times I needed a global temperature but for obvious reasons I do not think it would be ethical to use reconstructions that I feel are fraudulent. This has left only UAH6 (which is the best impartial temperature we have in terms of the modern era from ~1980. Before that we now have a host of literally fabricated graphs that consistently add warming.
However, back in 1981, the guys at NASA were still in two minds about whether the world was warming or cooling. As such, whilst the data may have inherent biases like urban heating, it doesn’t necessarily have cherry picking of stations and processing techniques to manufacture an additional trend.
So, I started with a copy of Hansen et al 1981. Allegedly this is a 5 year running mean, but when I tried to match it to a similar running mean of UAH there was clearly far more variation in UAH. So, eventually I used a 20year smoothing on UAH 6.0
However, unfortunately, UAH starts in 1980 and Hansen et al finishes then, so they do not overlap. So in order to judge the the vertical offset I grabbed a copy of the Central England Temperature series. I’m not sure of the smoothing on this.
Hansen et al 1981 fits reasonable well – showing that CET is a good proxy for global temperature, but then the UAH 6.0 section shows a good start and then England is about 1C warmer between 1990 and 2009. I’ve checked several times and I can’t see anything wrong with the scaling so it appears to be genuine. It still needs work, but I’ll post it anyway in case anyone spots any obvious mistakes or has any ideas about vertical alignment.

Reconstruction of Global Temperature using CET, Hansen et al 1981 and UAH6

Reconstruction of Global Temperature using CET, Hansen et al 1981 and UAH6

Comment

Is it just me or does that “catastrophic global warming” scam look pretty daft when you see it shown thus. In particular – I’m struggling to reconcile is the feeling that there ought to be more warming in the last section … whilst knowing that on CET even the higher warming shown is totally unremarkable. So global temperature change shown red+black is less remarkable than not remarkable.

What’s all the fuss about?

Posted in Climate | 1 Comment