- We present initial findings showing a correlation between warming over Quebec & major US “flying holidays”.
- Research from NASA shows cirrus clouds, formed by contrails from aircraft engine exhaust, can account for a warming trend in the United States that occurred between 1975 and 1994.
- Previous work has shown a similar global relationship between industrialised and warming “hot spots”
- As such 1970-2000 warming now appears to be strongly linked to aeroplane contrails
Introduction – the land-sea temperature divergence
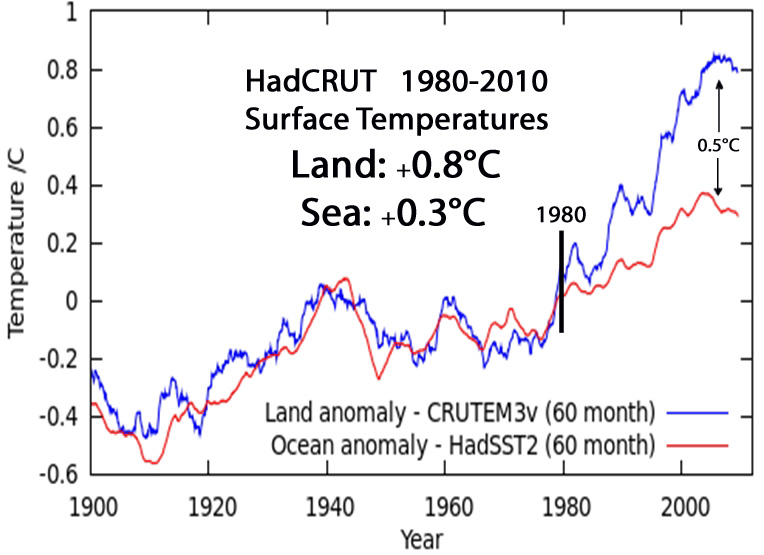
As many have identified, the land and sea temperature records have been diverging since around 1970. This from NoTricksZone
Regional Hotspots
Interestingly this graphic comes from a paper linking this same divergence in NoTricksZones with urban heating. However, there is a problem with their hypothesis and that is the regional distribution of this warming as shown below: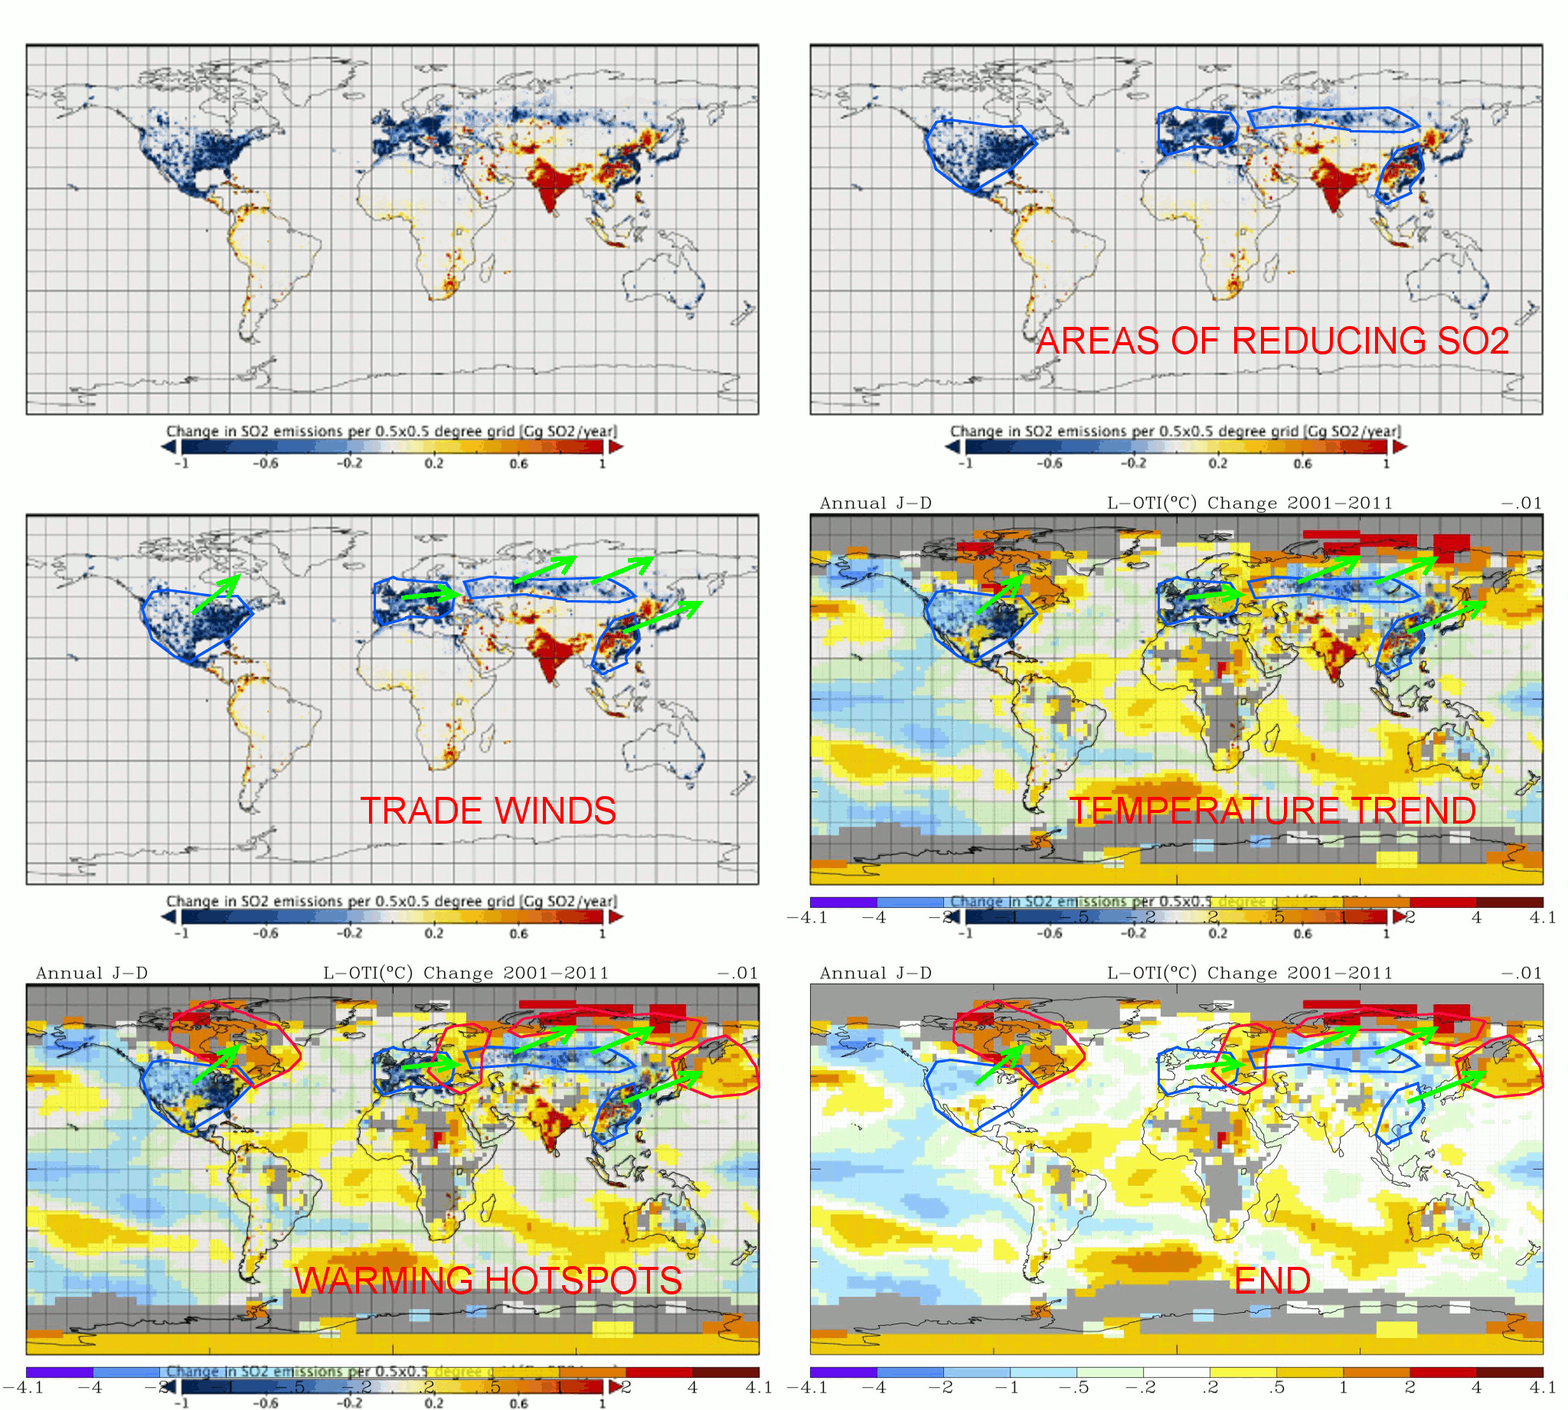
I showed that the Northern Hemisphere hotspots over this time period were clearly linked to areas of economic activity by being about 3-8days downwind in the direction of the normal surface wind direction. (But see discussion).
This suggested that either since the 1970s we had started doing something that caused warming downwind or that something we had been doing had cooled the climate and was being reduced.
Link to economic activity and pollution?
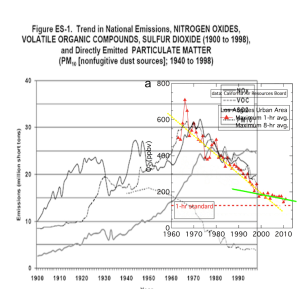
Instead, the geographical spread of the warming zones appears to link it to economic activity. Thus I have suggested that the cause was the change in pollutions levels since the 1970s:
This explains not only the 1970s cooling (a period of increasing pollution), but also the 1970-2000 warming as well as the 2000+ Pause (or slow-down). Therefore given that pollution levels were generally reducing and that areas downwind to were experiencing the warming I proposed the following test:
Hypothesis
that if we were to experimentally release vast amounts of pollution over a few nights over large regional areas we should see a significant lowering of temperature in a region around 2 to 2.5 thousand miles “downwind”.
Of course, I didn’t expect governments to actually create pollution just for this test, but I did suspect that fireworks released in events such as the US 4th July might have a significant and measurable effect on Canada for the next few days and allow me to test the hypothesis of pollution induced cooling.
Results
I started downloading data by hand and the first few stations looked promising with a change after 4th July. However, the changed appeared to show warming rather than cooling. Never-the-less I realised that I’d forgotten that being a holiday it was possible that whilst fireworks were creating one type of pollution, that the holiday period was causing a reduction in other types.
So, I then downloaded all 27,000 station-year files for the province of Quebec (a large province sitting under the “hot spot”). For info this amounts to around 10million temperature readings.
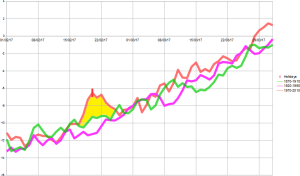
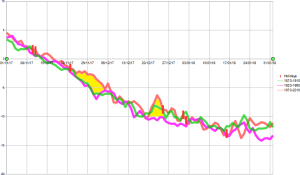
The data around the 4th of July was first assessed. However no deviation that could be distinguished from normal variation was found. However, as the data was checked three periods stood out as having abnormally large deviations these were:
24Nov – 6Dec (Thanksgiving 22-28)
17Feb-26Feb (Spring break 15-21)
20Dec-27Dec (Xmas)
The data for these periods are shown below:
Key
Green: Average 1870-1919
Pink: Average:1920-1969
Red: Average: 1970-2016
The spring break was particularly pronounced, the Thanksgiving and Xmas breaks were clearly present, but less convincing.
Far from causing cooling as I originally hypothesised, the deviation was warming. And rather than the effect being greatest in the 1970s when pollution levels were greatest, the effect was only showing up from the 1970s onward, not on the 4th July as predicted but at other periods of the year clearly linked to the Spring, Thanksgiving and Xmas break holidays. Either going on holiday was causing the US to stop doing something that usually cooled the climate – since 1870!! – which seems highly unlikely or more likely something the US citizenry now did at Spring, Thanksgiving and Xmas break was causing warming.
Search for the Culprit
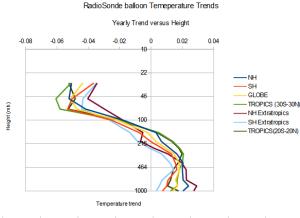
The culprit must be something we are now doing that is causing warming. Given the profile of the atmospheric warming as shown by balloon data (right) indicated a change from warming to cooling at 10km – the average height at which passenger jets fly, these are a very strong candidate.
Looking online I found that the three period identified from the Quebec data as showing warming corresponded with peak periods for flying in the US(link). This suggested flying or perhaps more broadly travel of some kind was a potential culprit.
Two candidates seemed likely: flights themselves or perhaps particulates from diesel.
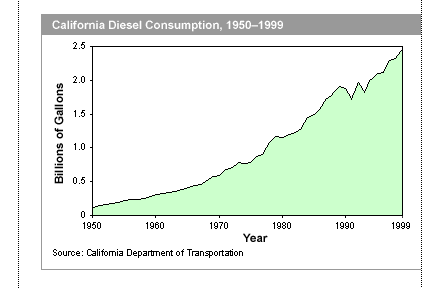 Diesel Usage rising from 1950 to 2000 Diesel Usage rising from 1950 to 2000 |
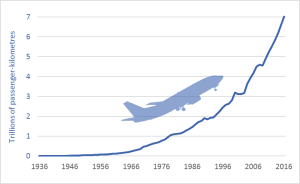 Aeroplane usage rising from ~1970 to 2016 Aeroplane usage rising from ~1970 to 2016 |
Diesel use has been increasing, but that trend started around 1950 which is too early for the effect identified above. So, the clear front runner was aeroplane flights and the likely mechanism was contrails.
Physics of Contrail warming
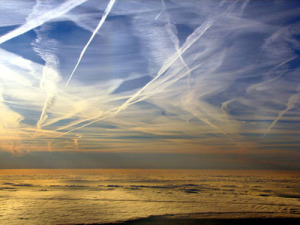
To understand how contrails cause warming, we first need to know that aeroplanes fly at approximately the height of the tropopause or 10km. Thus the clouds they form are at the coldest part of the (lower) atmosphere with a temperature around -50C.
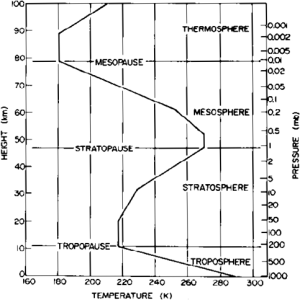
Next all we need know, is that the energy lost into space is determined by the average temperature (or average heat) as seen from space. Thus for the earth to be in equilibrium the average temperature must be that of an equivalent black-body which on a an airless earth (where heat is spread evenly) will be 256K.
Thus if part of the IR leaving the earth from the surface at 288K is blocked by contrails which then emit at 220K, because they are 56K colder than the average temperature thus substantially lowering the average temperature of radiation leaving the earth and therefore substantially reducing the outgoing IR energy. This in turn causes warming of the surface until it again reaches equilibrium with an average outgoing temperature of ~256k. From this we can estimate the coverage of contrails to achieve a 0.5C increase in temperature as shown in the first graph between the land and sea.
% coverage (100% opaque equivalent) = 0.5C/56C = ~1%
For argument if we assume the contrails are 50% transparent, then 2% of the sky needs to be filled with contrails to achieve this level of warming. Because the clouds are slightly cooler than the surface, the figure will be around 2-4% (for 50% transparent cloud).
In fact, when researchers estimated the amount of sky covered by contrails they estimated that:
If there were no other clouds in the sky, contrail cirrus clouds would cover up to 10 percent of European skies and about 6 percent over the east coast of North America, another heavily trafficked region, they calculated. (source)
Note they do not say what they meant by “cover” – this could be extremely thin cloud, but the figures are in the right ballpark.
This is also one of those areas where the greenhouse theory needs to use the proper physics and not the overly simplistic idea of “heat trapping”. Because it’s easy to understand how Cirrus can trap heat in a cloudless sky, but it isn’t so easy to understand how this heat trapping works when there are low-level cloud. The reason is because Cirrus clouds are even colder than the lower clouds, in regions where they are present, they cause the average temperature seen from space to be much lower.
However, the issue is further complicated because during the day Cirrus cloud reflect some incoming sunlight.
Again, what we really need is to carry out a massive experience, eliminating contrails for a few days to prove or disprove their effect. Fortunately such an experiment has already occurred:
911 – a tragedy but also an experiment with Controls
They disappeared from American skies briefly when nearly all airtraffic was grounded after the 9-11 attack.
In the wake of the 9-11 terrorist attacks, the US authorities prohibited commercial aviation over the United States for three days. David Travis, an atmospheric researcher at the University of Wisconsin, took a look at how temperatures differed around the country.
Contrails reduce daily temperature range (2002)
Travis DJ, Carleton AM, Lauritsen RG.
It was found that for those three days, the average range between highs and lows at more than 4,000 weather stations across the US was 1 degree C wider than normal. Contrails do have an effect on the temperature, but unfortunately as there was no control over average temperature, this can be interpreted in a number of ways:
- Contrails increase night time temperatures and reduce daily temperatures (with no change in average)
- Contrails increase night time temperatures with less/little effect on daytime – leading to overall rise in temperatures.
- Contrails reduce day time temperatures with less/little effect on night time – leading to an overall drop in temperatures.
Now however, assuming the holiday warming effect is due to contrails, we can very clearly eliminate any suggestion that contrails lead to any form or cooling and instead these latest results looking over 50 years of data show contrails cause as much as 3C warming during the spring holidays. Furthermore based on Travis et al, we can conclude that the main effect appears to be to increase night time temperatures.
Thus finally we have proof that contrails have caused much of the warming from the 1970s to 2000. A fantastic breakthrough – am I about to get a Nobel prize, etc. etc. – well NO!
NASA already knew about Contrail warming:
Gretchen Cook-Anderson
Headquarters, Washington
(Phone: 202/358-0836)
Chris Rink/Julia Cole
Langley Research Center, Hampton, Va.
(Phone: 757/864-6786/4052)
April 27, 2004
RELEASE : 04-140
Clouds Caused By Aircraft Exhaust May Warm The U.S. Climate
NASA scientists have found that cirrus clouds, formed by contrails from aircraft engine exhaust, are capable of increasing average surface temperatures enough to account for a warming trend in the United States that occurred between 1975 and 1994.
“This result shows the increased cirrus coverage, attributable to air traffic, could account for nearly all of the warming observed over the United States for nearly 20 years starting in 1975, but it is important to acknowledge contrails would add to and not replace any greenhouse gas effect,” said Patrick Minnis, senior research scientist at NASA’s Langley Research Center in Hampton, Va. The study was published April 15 in the Journal of Climate. “During the same period, warming occurred in many other areas where cirrus coverage decreased or remained steady,” he added.
“This study demonstrates that human activity has a visible and significant impact on cloud cover and, therefore, on climate. It indicates that contrails should be included in climate change scenarios,” Minnis said. (source)
Discussion
Paradoxically, whilst around 1million individual temperature readings were used, the results are still very noisy. The reason for this is clearly because whilst there is a lot of data, it is all experiencing similar weather. Thus the large amount of data is increase the precision we know the variation in any year, but increasing the number of stations does not reduce the year-to-year variability. That is why the data is shown in chunks of approximately 50 years, as this was the only way to significantly reduce the year-to-year variability to bring out any signal from the noise. However, even so, the signal for at least two of the periods is barely discernable above the noise, and even for the Spring break, it is only the length of the break that gives a robust enough signal to bring it above the noise level.
What is also interesting is that we now have the problem of too little warming for the possible causes! According to the NASA paper they can account for the warming by contrails and according to Soon et al (NoTricksZones), they suggest the warming is due to the reduction in rural stations and the effect of urban heating.
But if we examine their claims in detail we find:
For instance, Ren et al. (2007) found that between 65-80% of the apparent warming trend over the 1961-2000 period for the Beijing and Wuhan station records was probably due to increasing urban heat islands.
And
According to McKitrick (2010), 75% of temperature stations across the globe have been removed since the 1970s, mostly from rural or non-urban areas.
In other words, whilst there is little doubt that removing rural stations globally will cause the apparent global temperature to rise, Soon cannot quantify this effect globally so the scale of this rise is in doubt. However, we do appear to have strong evidence. They cite China as one example and the effect in the US can be readily seen by the lack of warming given in this graph (when only taken rural stations):
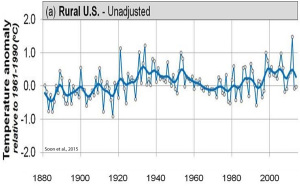 If we assume this effect is real, what does it do to the geographic distribution? It would tend to make areas like the US with high economic growth (and so large urban heating) cooler – further enhancing the difference between the cooling areas of origin and their hot spots. Thus if we cooled the areas affected by this “urban heating” effect on the map of global temperature trends:
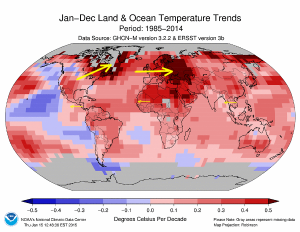
It would increase the contrast between now low warming industrial areas and their nearby warming “hot spots”. As such, Soon, etc. appear to enhance the contrast suggesting that (if we accept contrails as the main cause of 1970-2000 warming) that contrails produced during the day (or other pollution) may depress temperatures at the location of production but tend to increase temperatures about 2000 miles “downwind” (Note: in this context “downwind” means the wind at ~ 10km or the tropopause).
Could this “downwind” warming be due to daytime air reaching this hotspot during the night? Checking out today’s wind’s at 250hPa (below the tropopause), I find the air speed is around 100km/h and the direction is heading NE over the US. It therefore takes around 2000*1.6/100 = 32hours for the contrails to reach the area of the hotspots. That makes this idea seem unlikely. However, in certain areas known as “the jet Stream” (in which plains love to fly – if going the right way), the speed can go up to 250km/h. As such the time to travel 2000miles would be 12hours.
Summary
At this stage I think the best I can say is that the link between contrails and warming looks to be very strong. There does appear to be distinct warming “hot spots” which seem to occur over the same time period as contrails have been active. But whilst there may be a potential mechanism in strong winds at around 10km, this area needs more research.


Was all this not proved after the total ban on flying in USA following the events of “nine-eleven”?
It was proved there was a temperature change with a reduced difference between night and day – but like so much in this area, that was not taken as evidence that it changed climate.
Pingback: Contrail warming in context | Scottish Sceptic
I doubt that there are significantly more flights on holidays – just that the existing flights carry more passengers…
Thanks Ed – you’re literally the first comment about the result.
We sat in traffic jams yesterday on Easter Friday – and it got me thinking about fumes from traffic. The other possibility is that “less activity” from the holidays in some way leads to warming.
And do I really want to know?
Your contrail article is very interesting, but a bit mysterious still, it seems. I’ll look out for more comments. At the moment I’m not too well – heart is playing up – so am not as active as usual, and am waiting for things to improve (I hope).
Pingback: Could CO2 be a cooling gas? | Scottish Sceptic
Pingback: Can you spot the cause of “global” warming? | Scottish Sceptic
Pingback: An Xmas present to sceptics: Svensmark, Cosmic rays & Clouds | Scottish Sceptic