(Sorry not an April fool – I was planning something but I was making such progress I didn’t have time to complete).
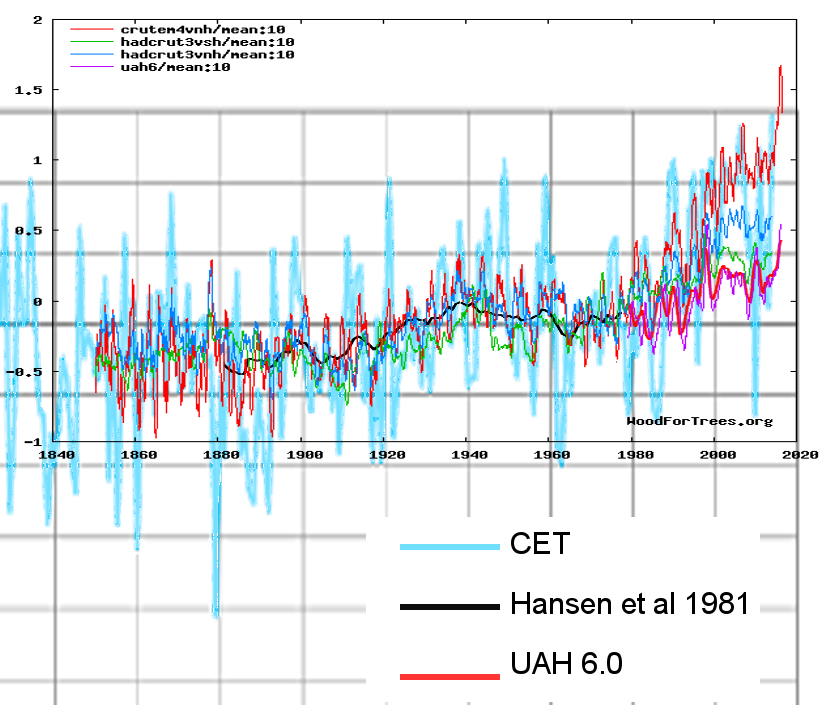
After examining the temperature records with a view to creating a single “reliable” record, I realised that something odd had happened around 1970 that caused Northern hemisphere land records to sharply warm compared to sea based and southern hemisphere.

Then when I found that the long-term warming could be closely linked to industrial zones the evidence seemed overwhelming that in some way pollution and not CO2 was responsible.
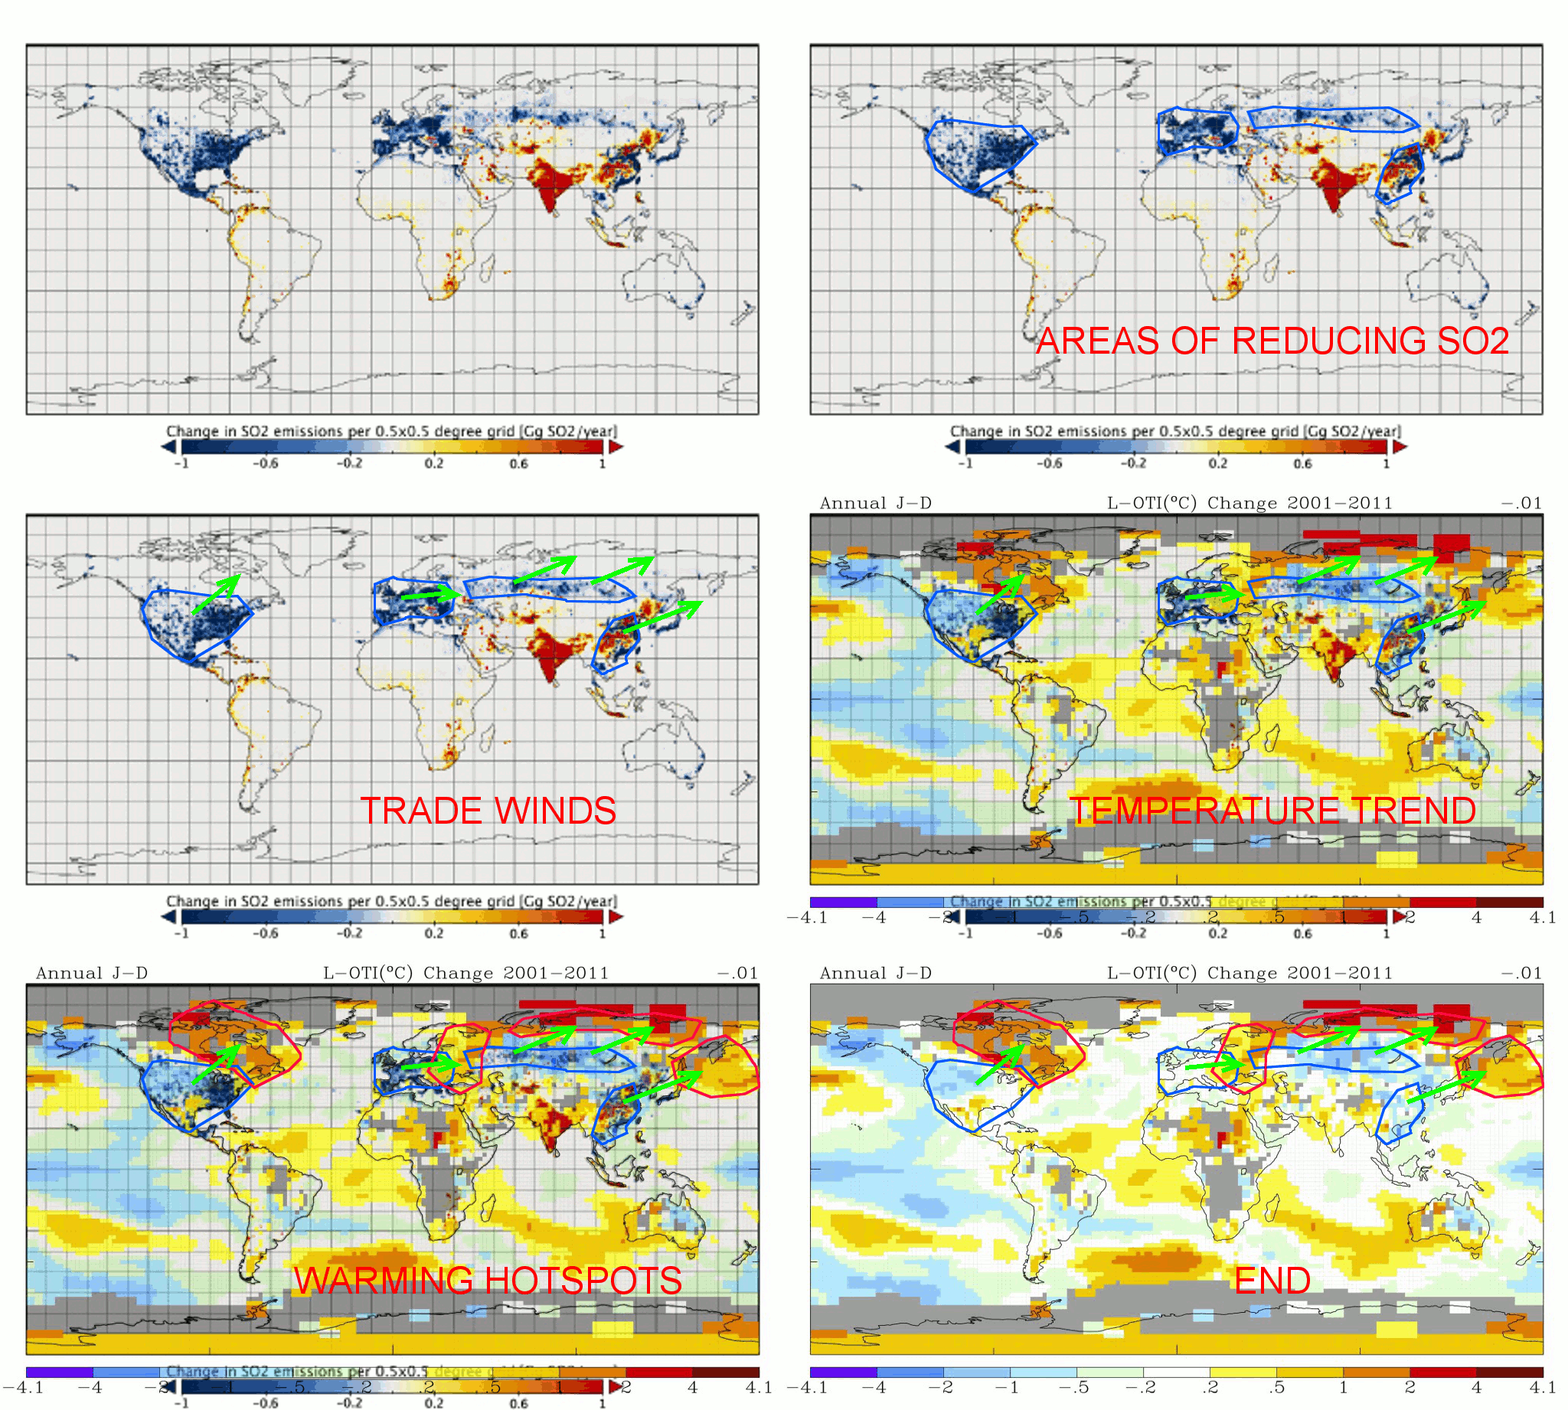
 The next key point was looking at China where I expected to find increasing pollution. The problem with China is it’s not clear which way is the “prevailing wind”. So when I found the SO2 map which showed that SO2 was extremely concentrated and you could literally see the downwind streak:
 And when I found I could match this directly to a warming zone down wind:
 This clearly was a “fingerprint” of human caused warming – but not CO2. But it also meant that the cooling zone to the NW could potentially be linked to the warming zone based on the same wind direction:

Note this really shouldn’t say “Trade wind” instead I’ve used the wind direction of the SO2 plume in China.
This shows that all areas of warming can be associated with areas that have been reducing SO2 emissions.
But paradoxically, there is no corresponding link that I can see between areas like India that have been increasing SO2 emissions.
Possibilities
- Total coincidence – perhaps I’m just seeing patterns in the noise. The reason I don’t believe this is because I didn’t start looking for patterns, instead I started trying to understand the divergence in land-sea temperatures.
- A change in technology for SO2 – what would explain the results is some kind of e.g. generation used in the 1970s that was very good at causing cooling, which has been replaced by technology which for some reason has very little effect.
- It’s possible that the Indian induced cooling – is hiding to the north and that the Chinese cooling is hidden by the reduction in SO2 from nearby areas.
- Finally, whilst I’m drawing maps of SO2, there is no reason why it couldn’t be something else associated with economies that produced SO2. It could be small particles of ash produced whilst burning coal, or even something entirely different like vehicle emissions. It would just be that societies that are concerned enough to reduce power plant SO2 emissions – also tend to be one that had controlled some other pollutant.
Changes to technology
When I estimated the distance between the US polluting areas and the hotspot I calculated the distance as 2000 miles – or 3 to 8 days downwind based on surface winds. When I did the same in China the distance was 2500 miles but I have no details on winds.
There is however a huge problem. First, the wind speed and direction varies dramatically as we rise up the atmosphere. Second any “hot” pollution would surely rise within hours to the cloud layer? And because it tends to “punch” through the surrounding air, rather than heating a large area, it would instead tend to cause cloud in a fairly concentrated area and whilst there might be a lot of cloud – its effect would be very limited geographically.
So, I’m tending toward the view, that what is the source of this climate altering pollution is either “low heat” – in the sense that it’s from dispersed outlets that rapidly cool to the temperature of the environmental surroundings so only get lifted a few 10s of meters by their own heat, or the pollution is “hot”, but perhaps laden with moisture which then condenses causing the hot air column to collapse and halt in its upward trajectory.
Either way the pollution is getting well mixed in the boundary layer of the atmosphere so that rather than causing a lot of cloud in a very small area, when natural processes do finally cause it to rise to the cloud layer, the now very dispersed pollutant has a small but significant effect over a huge area.
This might explain why areas where there is increasing SO2 (or other correlated pollutants) are not leading to obvious areas of cooling: the key pollutant(s) are being released in a way that does not lead to widespread dispersal before being naturally lifted to the cloud forming layer.
Implications
If the 1970-2000 warming was caused by a technology that has largely been phased out – then identifying the exact cause will be extremely difficult unless by some miracle someone did some research that can in some way link some pollutant with warming/cooling.
Indeed, if the pollutant were coal-produced SO2, the key cooling pollution may have occurred as early as the 18th century well before the widespread measurement of the climate. The induced warming from reducing household coal use, would not be easy to detect, because small community scale coal fire electricity stations would/may have had a similar effect to household coal.
What we really need to prove it, is a society that rapidly started using coal – after the widespread monitoring of temperature – and then rapidly changed to a non-climate altering form of power – when I can’t be sure what form of power would not alter the climate (or even whether it might be associated pollution like vehicle emissions).
Thus the implication is that it would be very difficult to prove.
Entrenched interests
Greeenblob: For obvious reasons the green-blob does not want to hear that “the world’s greatest problem” was caused by them – but don’t worry, it’s now stopped.
Politically Anti-Greenblob: Likewise those who are against the left-leaning greenblob for purely political reasons, don’t want to hear that the greenblob were right: we were altering the climate. Because that will mean it’s right to tie their hands and that they cannot be carefree about what they do to the environment (thus giving the left-leaning obnoxious greenblob influence).
Academics: who large numbers for most reasonable purposes acted as part of the green-blob, don’t want to learn that they got “the biggest problem in history” disastrously wrong. And worse, that a bunch of outsiders they insulted at every possible turn, were right.
Journalists and Media: Don’t want to hear of problems that have gone away
Sceptics: And sceptics are no more keen to hear what would appear to them to be “speculative theories” dismissing CO2 as hear them in support.
So, I think I can safely say that if you are reading this, you’re likely to be one of the few academic/scientists with an open mind (and a sense of humour)
Implications for Future Temperature Trends
First, whilst there is a pollution effect, let’s start by saying there will be many other things in the mix. However, the lack of obvious cooling from sites increasing SO2 and the warming caused by those reducing SO2 emissions, does suggest that even if I can’t pinpoint what the exact cause is/was – I can say it’s coming to an end (you can’t reduce pollution below zero).
What we can say is that globally pollution is seen as important. So, globally whilst there are pressures that would tend to increase pollution there are also social pressures to decrease it. This could mean both cooling and warming.
However, because I suspect pollution has been reducing since 2001, it implies that this tended to cause warming … which means the pause came about because of some other cooling effect. If this effect is still present – reducing changes in pollution may cause this to become dominant.
Too summarise: natural variation is predictably unpredictable. In contrast given I know so little about the cause of the pollution warming, this effect is unpredictable and it’s future cause is unpredictable. It’s not even possible to say the “average” guess of what human behaviour will do to the climate must be based on CO2.

