Little did I realise when I started looking for a metric to use to represent the real global temperature for the last few hundred years that I might stumble across such compelling evidence.
First to recap.
Understanding the Global Temperature “discrepancies”
Started by looking at the various temperature series to try to understand the differences.
Understanding the Global Temperature II
Took this further and suggested that a combination of satellite temperatures and before that global sea surface temperatures and before that the Central England Temperature records would form the best basis of a proxy.
Understanding the Global Temperature III
Discussed the the discrepancy between sea and land based metrics which depart from each other around 1970 and are particularly acute in the northern hemisphere, but noted that the year-to-year based changes shown on UAH were found only in the land based metrics.
Understanding Global Temperature IV
Presented a pseudo proxy based on all the above work. (And the next step was to check this against various proxies).
Understanding the Global Temperature V – Met Balloon Data
Presented an analysis of the metrological balloon data. This was separated by height and because it was not clear which height I should use, I plotted the lot, only to find a very obvious change in temperature trend with height. Unfortunately, the hand waving argument I used to understand whether this could be the “fingerprint of CO2” was wrong.
Understanding the Global Temperature VI
So, the next article corrected the previous analysis showing that the change from heating to cooling occurred at ~10km. This is both the height at which aeroplanes fly AND the top of the troposphere. So whilst it could be contrails, it could also be something happening in the troposphere.
However, on the basis that the main heating discrepancies occurred over northern land and might be explained by contrails at around 10km, I investigated the global distribution of aeroplane flights and tried to correlate this to the 1985-2014 map of global temperature trends. This worked for group based winds, but not higher ones, leaving me questioning whether contrails were really responsible.
Understanding the Global Temperature VII
Went back to look at the original aim which was a global temperature reconstruction. And asked the question: why is the global satellite year-to-year temperature change best reflected by 1/7 of the earth’s surface: the land-based year-to-year changes, but the long term satellite (&CET) changes by sea surface temperature. (I have no answer to this yet).
Understanding Global Temperature VIII
Today, I’m going to look more at the global flow of industrialised aerosols and present a possible explanation for global temperature changes – at least since 1970, and potentially long before.
Man-made Pollution & Global Dimming
A long time ago, I read and article on “global dimming”, measured by pan evaporation techniques (yes a pan of water allowed to evaporate), which reported that after a peak, the effect had been disappearing.
For a good summary read a paper such as: “The cause of solar dimming and brightening at the Earth’s surface” but a quick summary is as follows:
Global dimming is the gradual reduction in the amount of global direct irradiance at the Earth’s surface that was observed for several decades after the start of systematic measurements in the 1950s. The effect varies by location, but worldwide it has been estimated to be of the order of a 4% reduction over the three decades from 1960–1990.
Global dimming is thought to have been caused by an increase in particulates such as sulfate aerosols in the atmosphere due to human action.
It has interfered with the hydrological cycle by reducing evaporation and may have reduced rainfall in some areas. Global dimming also creates a cooling effect that may have partially counteracted the effect of greenhouse gases on global warming.
There are obviously a lot of red flags. The key one is that global dimming caused: COOLING OCCURRED. Or to turn it around, as global dimming reduced in effect toward 1990, it would cause GLOBAL WARMING.
When I looked at decadal trends regionally and via met balloons vertically, I found that the biggest changes were: a linear land change from 1970; a “warming blob” NE of the US and E of Europe, and that above 10km (33thousand feet) there had been cooling and below warming.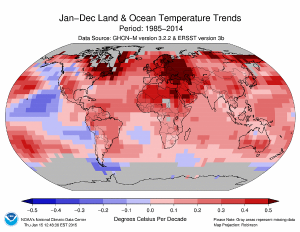
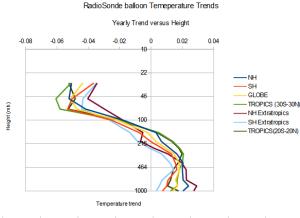
(see:Understanding the Global Temperature VI)
One possibility for the vertical changes is that there is some change in the atmosphere which is trapping heat below OR there is a reduction in some cooling mechanism (solar blocking clouds (perhaps caused to form on sulphite nuclei before 1970s clean air legislation?). However the big changes also happens to occur at the Troposphere-Stratosphere divide so it could be some complex reduction in troposphere to stratosphere temperature flow.
There are a couple of important things here. First the “hot spot” is downwind for the lower atmospheric prevailing wind from the US. Whilst these changes are not much greater than the normal variations, they may be significant. If so it’s important that the wind direction changes with height. I don’t as yet have information at what height the prevailing winds change from SW to W, but this point would set an upper bound for “US created” warming. If this is below the flight height of aeroplanes it may help to rule out contrails (although there are a lot of flights across the Atlantic).
The second point is that the timing of Chinese “pollution” is very different, and rather than reducing pollution levels since the 1970s its likely that many types of pollutants have increased. So, I think if we can detect a difference in the temperature trend “downwind” of the Chinese industrial zone, measure its timing and so link it (or disprove a link) to changes in Chinese pollution this could prove (or disprove) a pollution based causation for global warming.
However … then I came across a model by NASA which simulates the movement of man-made pollutants (shown in white).
Source: https://gmao.gsfc.nasa.gov/research/aerosol/modeling/nr1_movie/
This suggests an even closer correlation between the 1985-2014 trend and human pollution.
This now explains the following hotspots on this map:
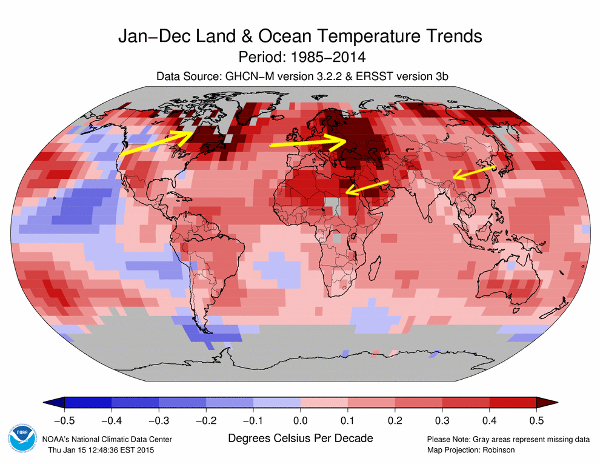
- The hot spot to the NE of the USA is clearly downwind.
- I now see the warm spot in the SW of of the USA is because there are often winds from the east at this latitude
- The hot spot to the east of Europe is clearly downwind.
- At times the winds from Europe head over the middle east/Eygypt – this may explain the warming spot here.
- There’s a lack of warming across China – this may reflect INCREASED pollution here.
- Also the lack of warming on the west coast of N & S. America also appears to coincide with a lack of pollution here
Explaining the distance down wind
If we assume an average speed of 10-30mph for the winds, the peak of the hot spot for the US is very roughly 2000miles from the industrial zone. This suggests whatever caused the problem takes approximately 70-200hours or 3-7days to form. This fits very closely with the know time for dust to be removed from the atmosphere:-
Although dust plumes from the Sahara and Gobi deserts can be seen circling most of the globe in satellite pictures, aerosol particles in the lower troposphere (the lowest layer of the atmosphere, where weather occurs) are usually removed from the atmosphere by settling and precipitation within several days to weeks after they were produced. In the stratosphere (the atmosphere layer above the troposphere), chemical reactions of gases from volcanoes produce sulfate particles that can remain for one or more years, spreading over much of the globe.
The particles grow by absorbing water vapor and other gases. In moist air, clouds form when water vapor condenses onto these ‘cloud condensation nuclei’. These then grow into cloud drops, which eventually fall to the surface as rain or snow, depositing the particles on land or in the ocean.
(http://www.ucsusa.org/global_warming/science_and_impacts/science/aerosols-and-global-warming-faq.html)
The Effect of 1970s clean air acts
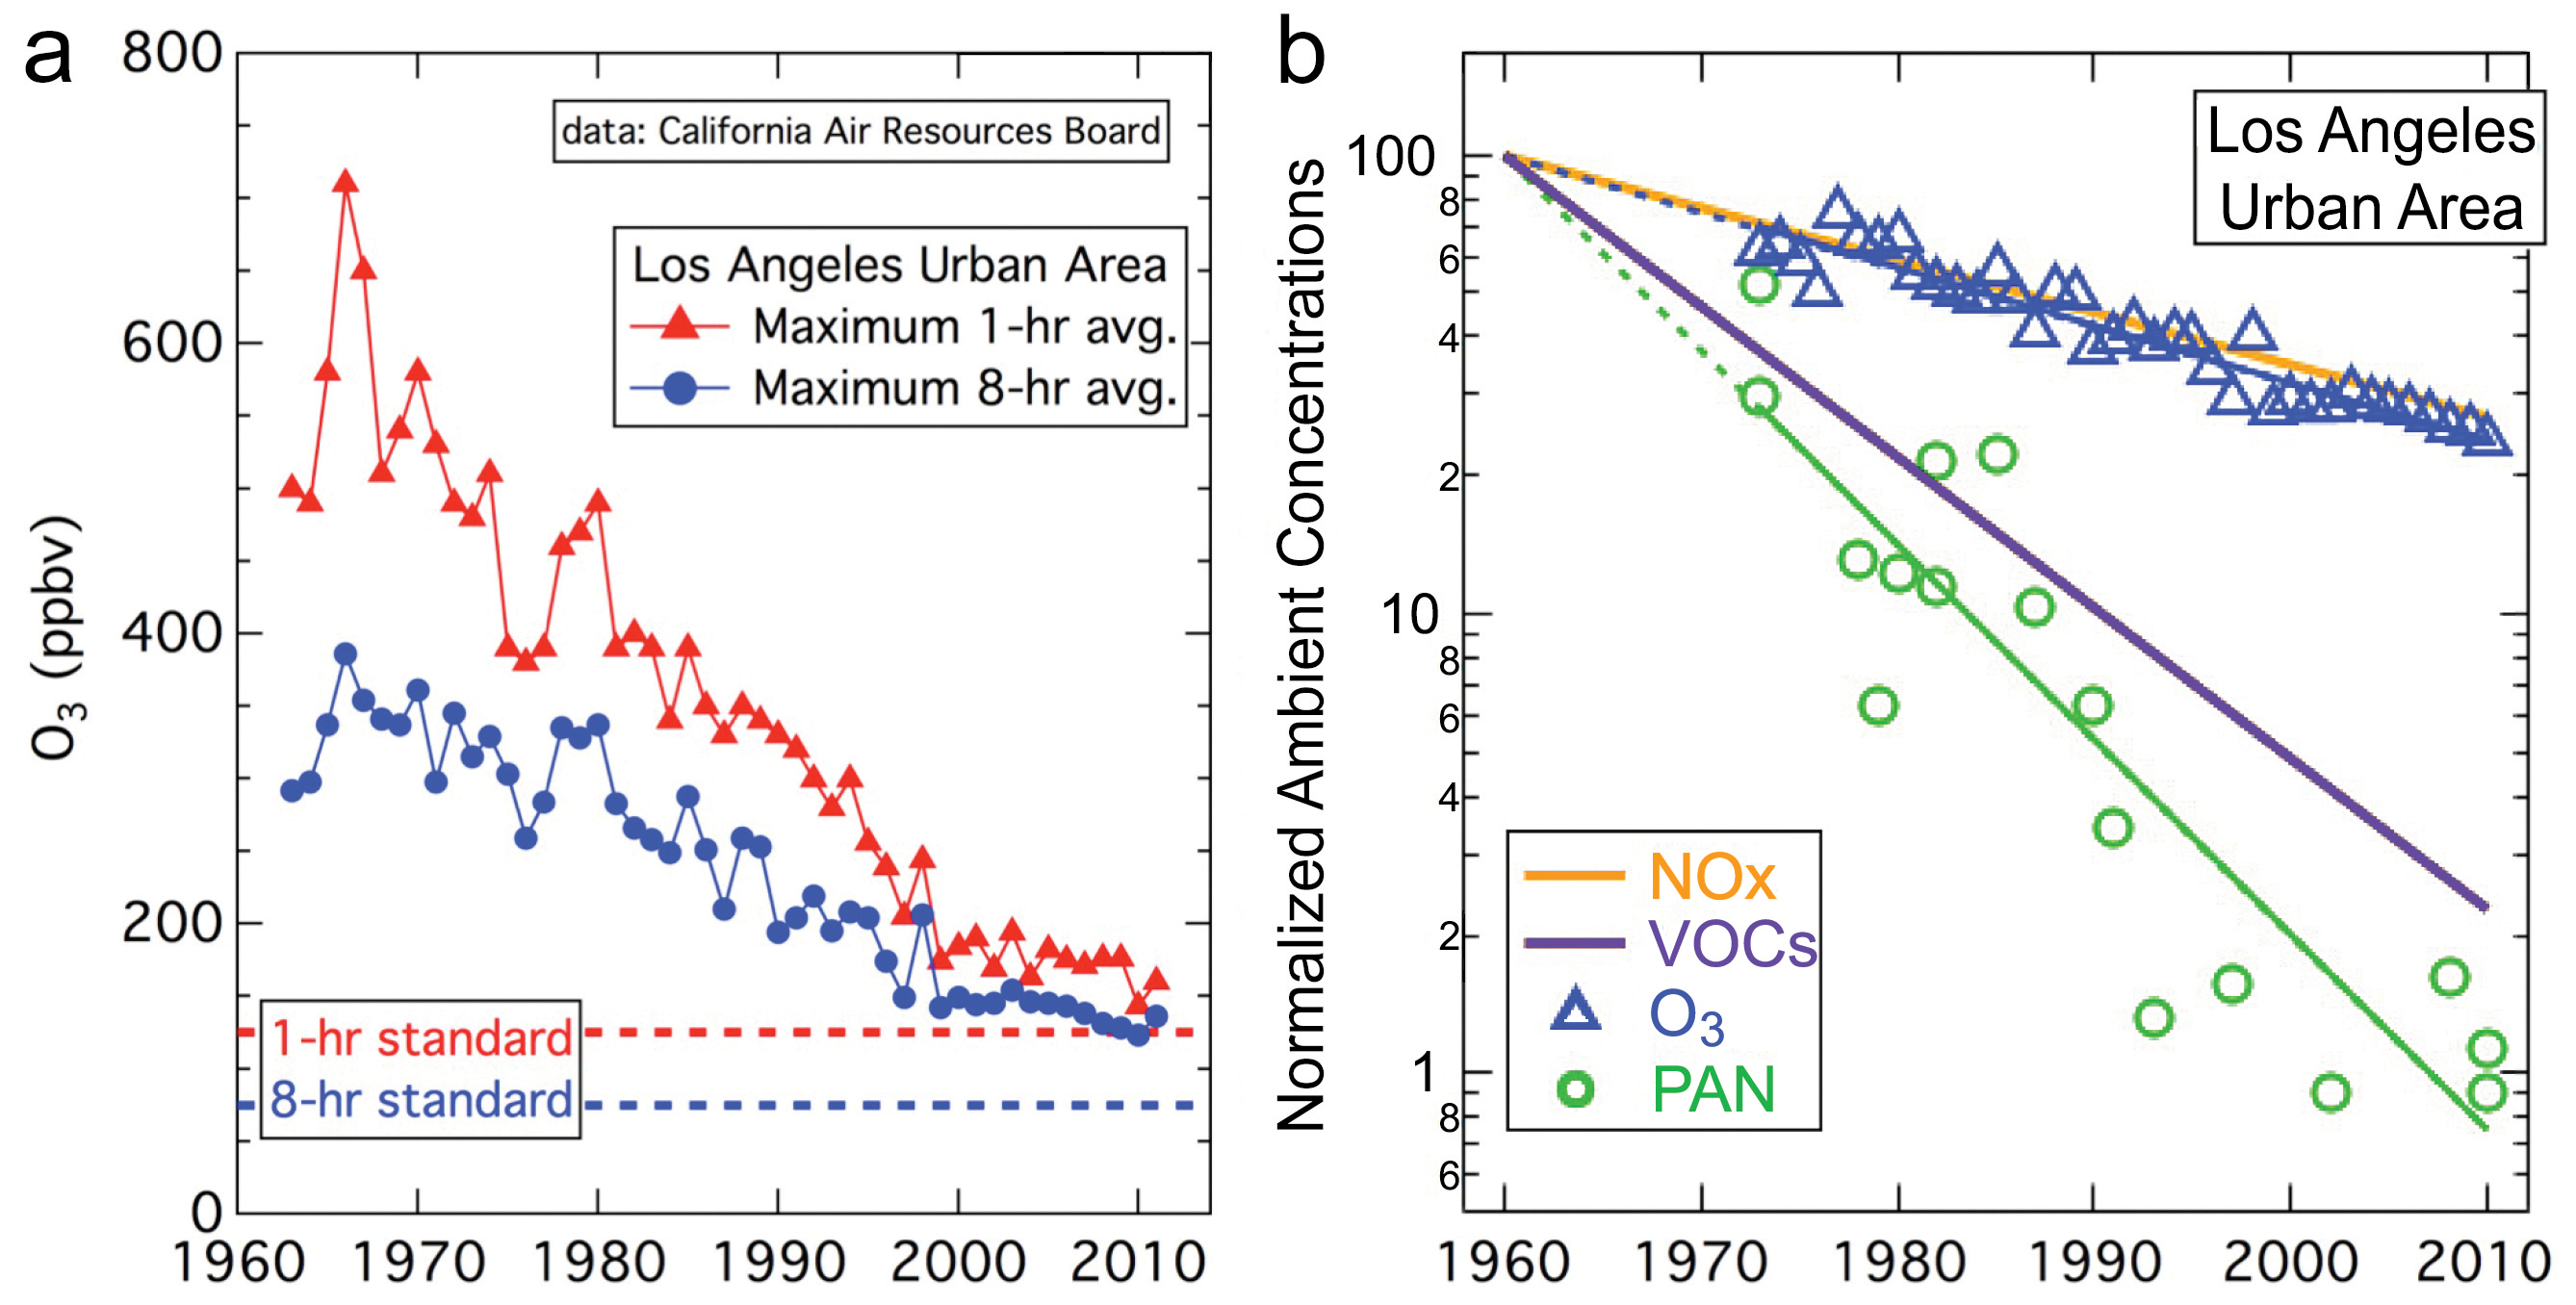
As “the west” recovered from WWII, the growing prosperity and use of motor cars & coal fires etc. created pollution problems which came to a head around 1970 (the period of concern for global cooling). One potential explanation for this observed cooling was the effect of rising man-made pollution in the atmosphere. As a response in the 1970s governments started tackling the problem with a series of clean air acts which have since reduced various types of pollution. If these pollution had caused global cooling, then their removal would cause global warming.
 Solar Activity
It has long been known that there is a correlation between solar activity or the cosmic ray index and global temperature as shown below:
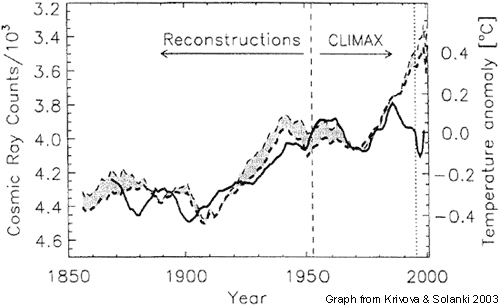
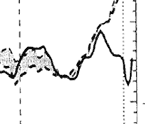 But whilst, the correlation is good at the start about 1980 the relationship appears to break down. Global temperatures continue to rise but the cosmic ray index (if causal) would suggest lower temperatures.
If however, that post 1980s warming can be attributed to the reduction in pollution that occurred post 1970s clean air acts, then this strengthens the suggestion of a solar impact on temperature and may suggest that the dominant factor for long term temperature changes is solar activity.
And just as it is suggested that ground based pollution results in the formation of clouds by acting as nuclei for water droplet formation in clouds, so cosmic rays may also act in a similar way creating ionisation that acts as nuclei for the development of cloud droplets.
Discussion
The most probable cause of recent global warming since ~1970 appears to me to be the reduction in ground level pollution, which was being taken up into the atmosphere and acting as cloud condensation nuclei. This fits with:
- the timing of the divergence of sea and and Northern hemisphere land temperature records (starting around 1970 when pollution was reduced by a concerted effort to introduce clean air acts.)
- The location of hot spots (as above) – and note the lack of hotspot near China due to ongoing pollution.
- The distance from industrial areas fits with the time for cloud condensation nuclei to form and then be washed out as rain (3-7days)
- The vertical profile of temperature trend (with cooling below 10km in the troposphere and warming above)
Conclusion – It was the Greens wot done it
This is all very strong evidence suggesting that the main reason for much of the post 1970s warming was NOT due to natural causes, and NOT due to CO2 but instead due to the REMOVAL of human pollution as a result of the green movement. Indeed, we could very easily call in “Environmentalist induced warming” due to the recovery of temperatures formally suppressed by pollution”. Indeed, if reducing pollution after the 1970s clean air acts led to warming, then increasing pollution (which presumably led up to the 1970s clean air acts) could ALSO be largely responsible for the global cooling scare of the 1970s.


It is well worth reading the Schneider 1971 paper (NASA/GISS). See:
http://vademecum.brandenberger.eu/pdf/klima/rasool_schneider_1971.pdf
This paper supports the view that aerosols are the main cause of the 1940/1970 cooling, and the clean air impacts are the main cause of warming after 1970.
It is interesting to note that the assessment of climate sensitivity to CO2 was very low, ie., an 8 fold increase in CO2 would cause less than 2 degK of warming.
Thanks for the paper Richard. Whilst there is undoubtedly a direct effect, I presume someone would have done the maths and found aerosols are not potent enough on their own (not always a safe assumption in this area of climate).
Thus I suspect the effect is more likely to that aerosols form the basis of cloud nuclei and that a small level of some kinds of pollutants leads to a much larger effect on solar reaching the surface than the mere aerosol on its own suggests.
However, if you’re reading that kind of paper, you’ll probably know that different clouds have different effects. Thus I think the aerosols may be drawn up into what I call “afternoon clouds” (Cumulonimbus which form from rising hot air).
Pingback: Understanding Global Temperature IX – the role of CO2 | Scottish Sceptic
Pingback: Understanding Global temperatures X – 1970s Global cooling and 2000s Pause | Scottish Sceptic