The leaky atmosphere hypothesis is that the earth’s atmosphere leaks away over relatively fast timescales equivalent to the ice-age cycle and that this leads to changes in pressure causing changes in global temperature as suggested heer: (overview, calculations),
Then I started checking this hypothesis. First I found:
This showed the Vostok ice cores had evidence of pressure change, but that instead of increasing when we can out of an ice-age it actually suggested a decrease. In retrospect, I think it is just a proxy for global temperature and that when it is warmer the ice is “more slushy”.
Then I checked extinction records and found a superb paper:
This appears to suggest that the animals that died out at the end of the last extinction had a lower metabolic rate. A lower metabolic rate would be an advantage if the air pressure was lower. But it is a relatively long and tenuous chain of inferences.
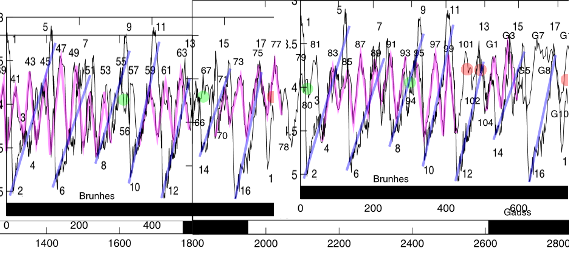
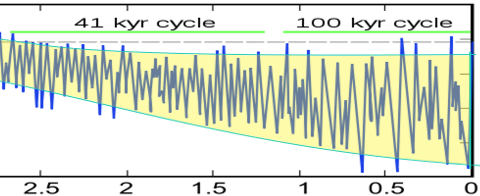
Then today I was answering a comment from Ian Macculloch on volcanism, when I suddenly realised that if there was “A” leaky atmosphere (i.e. unchanging), then the rate of leak should be a constant. And that therefore the rate should be a constant when the ice-age cycle was around 40,000 years long. And with a plot of 5million years of ice-ages I could easily check that! And by coincidence I had already highlighted the “decay” curve part of the ice-age cycle, so it was a very quick job just to overlay the 100k cycle over the 40k cycle As can be seen above, the slope varies, but I cannot see many of the 40k (purple) slopes that are the same gradient as the 100l (blue).
If pressure were the sole cause of the ice-age cycle this shows that the rate of pressure loss would need to vary. At first I though “Great” … that theory’s busted I can now just ignore it! Unfortunately, on reflection, I realised that whilst a geological cause to the leak is busted (as these should be pretty constant), a biological cause cannot be so easily dismissed, as there could be slow evolution and/or spread of some biological species causing the leak rate to increase.
Moreover, the 100k cycle is significantly larger than the 40k cycle. It’s no where near 2.5x the size, but if e.g. half the warming were due to pressure (constant gradient), and half was due to something like a change of state (3-1 cell hadley) then the leaky hypothesis could produce the recorded ice-age plot.
Oh *&%$ what is happening?
Fundamentally something odd happened during the ice-age cycle. Around 2.5million years ago, we seem to have entered an “oscillatory” phase of the climate leading first to a ~41k cycle length and then around 1million years ago that morphed into a longer cycle length of 100k.
This change in scale. On my monitor the 41k cycle starts when the amplitude is 1.5cm and the 100k when the amplitude is 3cm. That ratio is 1:2, whereas it should be 1:2.5. That isn’t a huge discrepancy (particularly when having to resort to measuring on monitors).

