I’ve been collecting a few interesting curves from the 1/f generator at uBurns.com and here is a selection showing the kinds of features that are typical of 1/f noise and which we regularly see being mistaken for “something”.
Note
First all references to “forecasts” is just my attempt at humour. It is 1/f noise, but such noise makes it impossible to forecast and it’s ridiculous to attempt to do so.
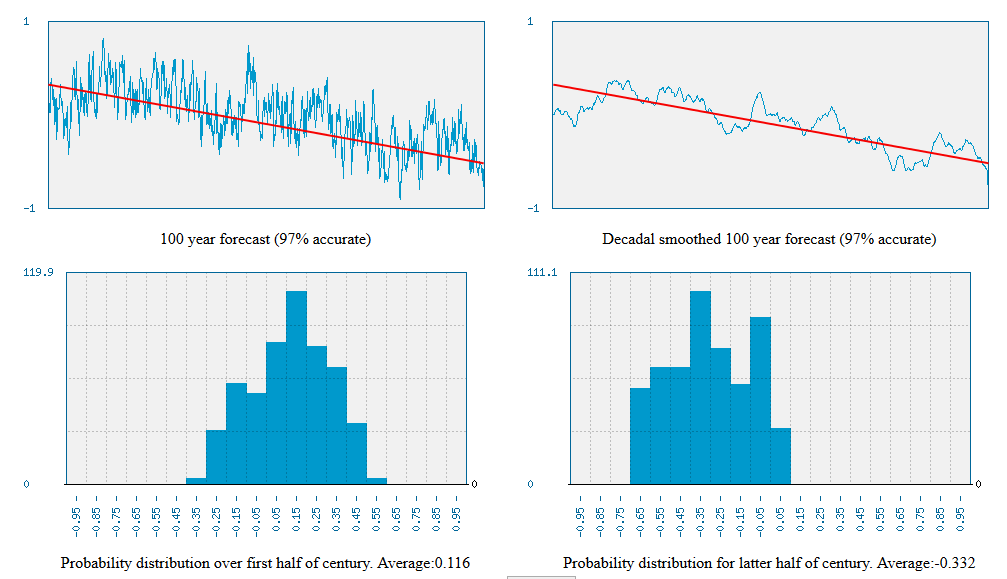
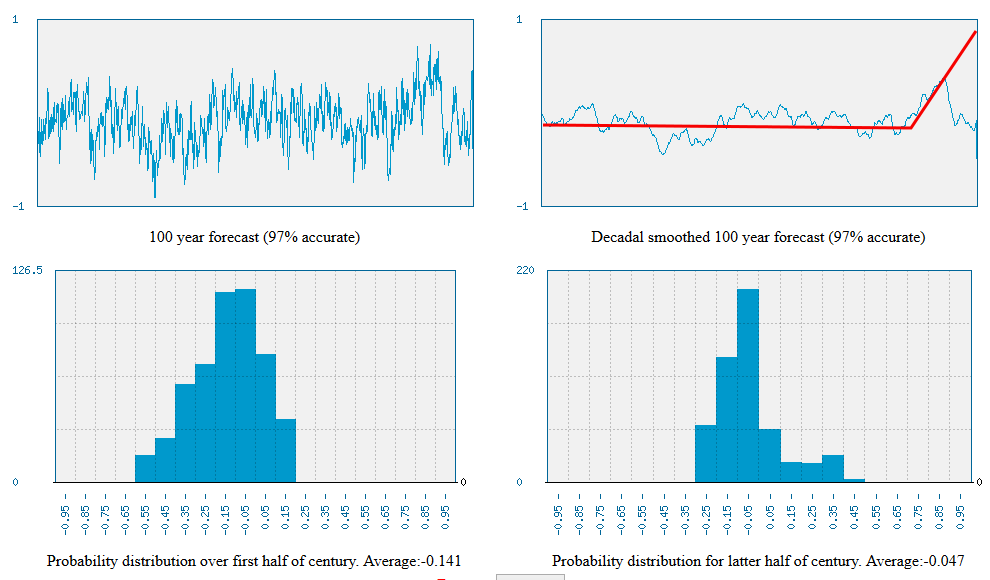
The plots are:
- Top left: simulated raw data 1/f noise (equivalent to yearly global temperature)
- Top right: Smoothed raw data (equivalent to decadal smoothed global temperature)
- Bottom left: distribution of first half of raw data
- Bottom right: distribution of second half of raw data.
Trends
Habitat of error: IPCC report and almost every alarmist website.
A very common characteristic of 1/f noise is that there will appear long-term trends. These are just the coincidental juxtaposition of smaller trends which happen all to go the same direction, but they clearly confuse some academics who cannot understand that such trends are perfectly natural.
Cycles
Habitat of error: Academia: Camp Century Cycles; Sceptic: WattsUpWithThat has regular articles on “cycles”[1][2][3][4][5]
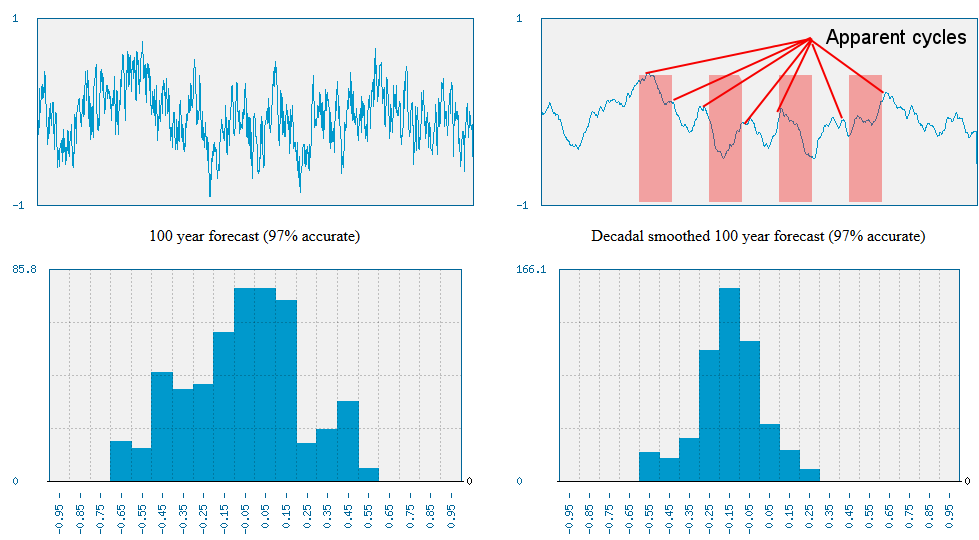
Another common feature is the appearance of apparent cycles. Below is a typical example. The cycles are far from clear in the raw data on the left, they are “brought out” by the “decadal” filter (due in part perhaps to “ringing”) and by the time I add details to highlight the apparent “cycle” they look very conclusive. However, notice that the 5th “peak” is actually a trough and that I’ve not drawn an arrow to it. Also note the way none of the peaks actually peak at the supposed regular demarcation lines. In fact they are just natural variation.
Steps
Habitat: Often “seen” in temperature station or other data as an apparent tampering. Unfortunately, this 1/f noise is very hard to distinguish from real changes such as replacement or relocation of stations . Such steps of which some (but not all) are undoubtedly real can be seen in examples at: Steven Goddard, climate Skeptic and even NOAA
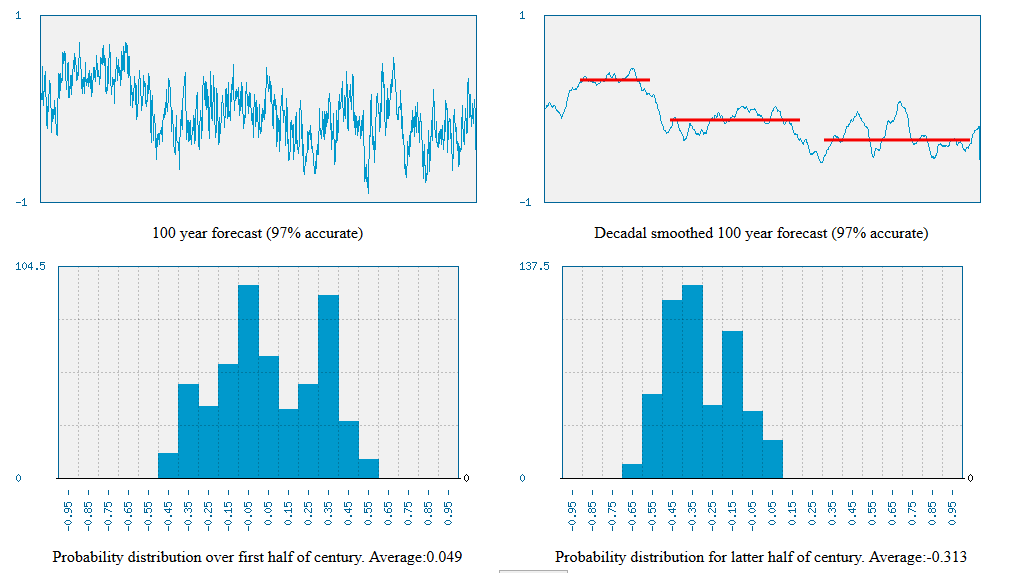
Another feature that appears fairly regularly are “steps”. Steps appear because they are features with a lot of low-frequency components and 1/f noise is rich is such frequencies. Again, the feature is hardly visible in the raw data, and I’ve “brought it out”, using lines to suggest levels.
Step/Double peak distribution
Habitat of error: This is the generalised form of the Hockey stick (see below) which is a version where there is a single step. When this occurs at the end of the plot (or the alarm is raised at the change so the change causes attention) it appears to be a single sharp upturn and becomes a hockey stick.
If you look at the probability distribution of the latter half to the lower right below, it contains a pronounced double peak compared to the first half which has a fairly nice “bell shape”. This shows how observers can be lulled into a false sense of understanding by their poor understanding of statistics of 1/f noise which doesn’t fit the “normal” distribution taught in statistics. So such simple interpretations can be lulled into interpreting a small set of values as “Normal” and then have a sudden surprise from what appears to be a large step – all of which is entirely within the normal natural variation of 1/f noise.
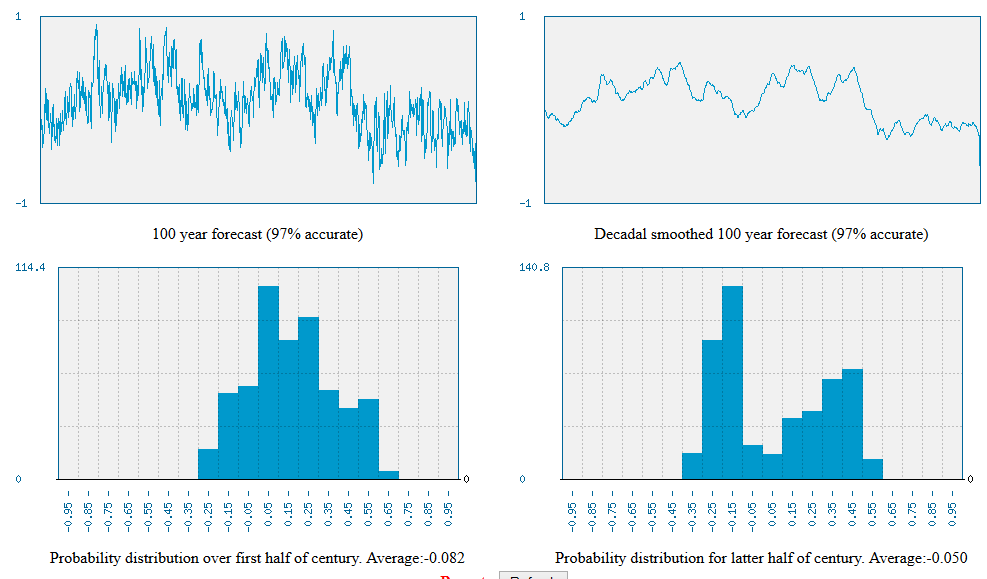
And here’s a variant where we see a sharp rise followed by a plateau (like the 1970-2000 rise in climate) . Again the latter half has a pronounced double peak which doesn’t fit the standard statistics for white noise and so is very easily misinterpreted as “statistical evidence” of a change.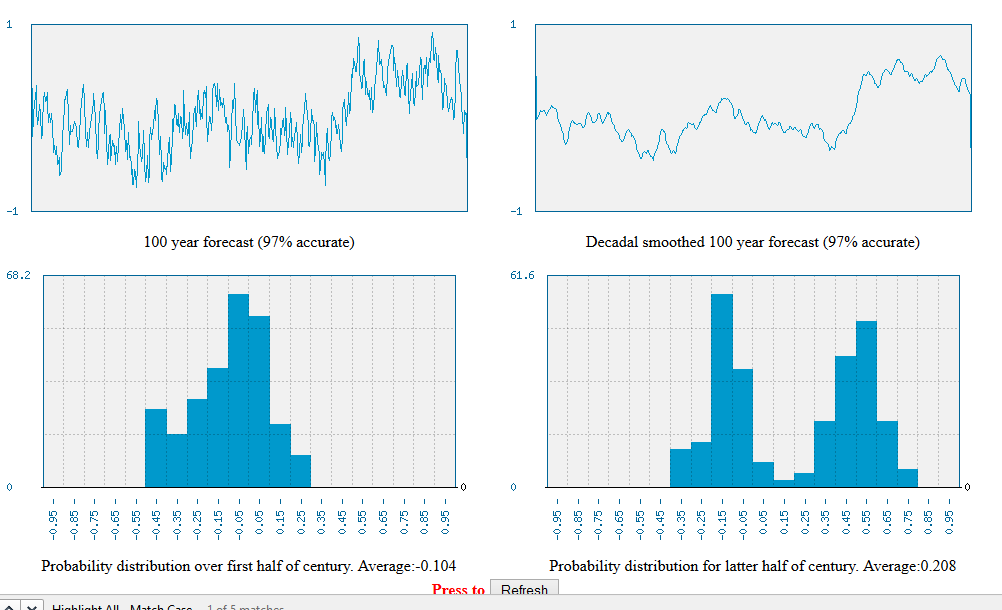
Hockeystick
Habitat of Error: Front page of IPCC reports & District of Columbia courts
The hockey stick is a form of step which generates a lot of publicity as it peaks, but as shown below, it usually just disappears into noise.


Pingback: Introduction to 1/f climate noise | Scottish Sceptic
Interesting plots, but I don’t understand exactly what is “f”? How is it defined mathematically? And what is the algorithm for generating your plots? Thanks.
Pingback: My Global Temperature Forecast: cooling ~0.35C by 2030 years | Scottish Sceptic
Pingback: Formal concepts of noise within Science | Scottish Sceptic