I’ve been working on the relationship between pollution and warming hotspots. Fortunately I’ve been using the general term “pollution” and not attributing the change to any specific chemicals or particles. Because things went a bit haywire as you will read.
1970+ warming trends
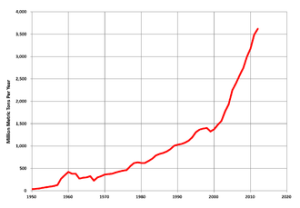
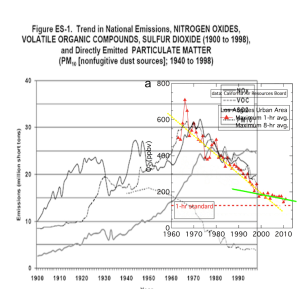
First lets recap the 1970s warming trend.To the right I’ve combined two graphs to show the general patter during the late 20th century of rising pollution to the 1970s in industrialised areas and then falling – followed by a final “we can’t cut pollution more than nothing” tailing off of the curve.
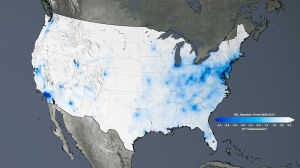
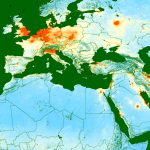
In compiling this article, I came across some interesting satellite images from NASA which help to visualise the density and location of pollution in the US and Europe:
As we can see below this correspond well with the 1985-2014 warming hotspots downwind from the polluting areas: NE of the US and East of Europe
 Warming During the Pause
We know China has been increasing pollution recently and it has been suggested this was the cause of the pause. So, this seemed a very good way to test the hypothesis that warming was caused by pollution. As we would expect to see much smaller increases in the hotspots associated with the US and Europe, but because Chinese pollution was increasing, there should be a coldspot in this areas. So, I searched until I found a temperature trend map for a suitable period.
We can see where it is pollution from economic activity is concentrated on the map of NO2 pollution below: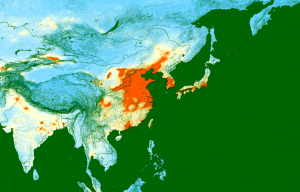
And what has been the trend in this area during the Pause?
There has been cooling in China (there are no predominant trade winds in this area).
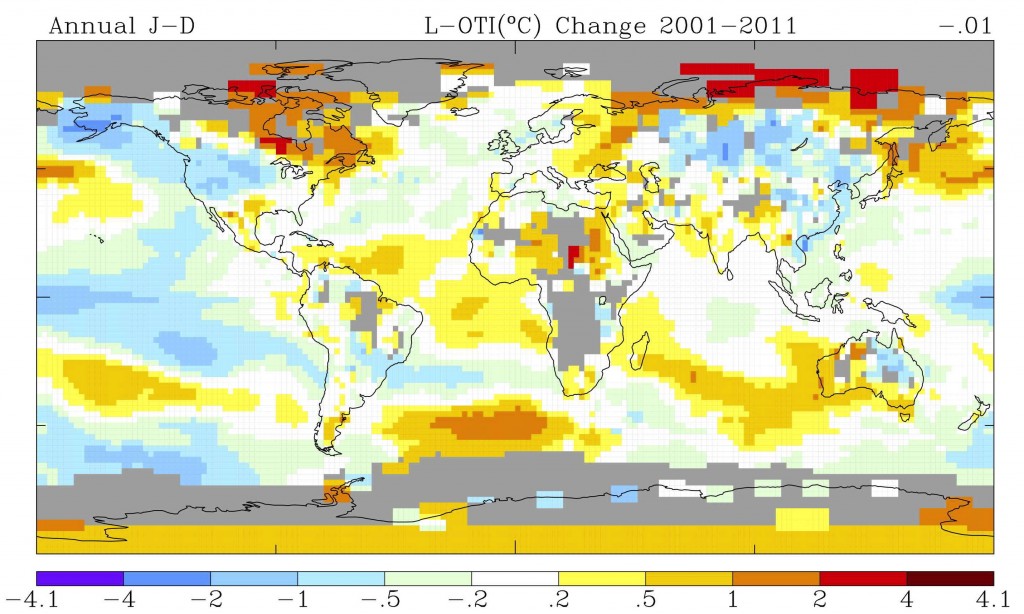 We also see other areas of warming. The US still seems to have a hot spot to the NE (corresponding with the general trend since 1985) this may be reduced (but difficult to tell because of different scales). However the European hotspot is very reduced. And the US West coast as seen cooling trend (California is obsessive about warming – and West coast were all voting like California for Democrats – is this connected?).
Remembering there will also be random variation, there are other apparent areas of warming North of Russia (does this correspond to increased Russian economic activity). And central Africa (there are few sensors in this area so it could easily be a fluke). Also East of China …
Japan & SE Asia
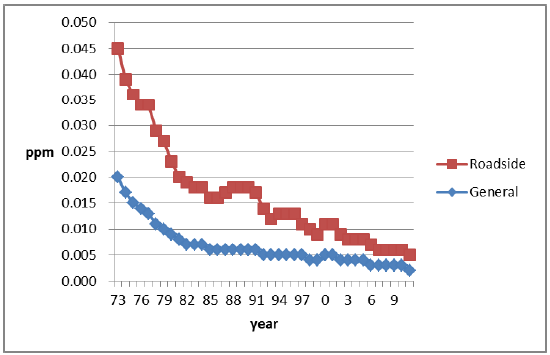
The warming east of China is interesting. Could this be to Japan? Japan industrialised like the West from the 1970s and as shown right it has had pollution reduction measures from the 1970s.
And similarly if we look at the NO2 pollution map, we see that Japan and some other areas like Hong Kong (S.coast) and Taiwan (island off China) are blue showing significant reductions in pollution. This means this area is more complex than I had thought particularly as the winds here go two different directions.
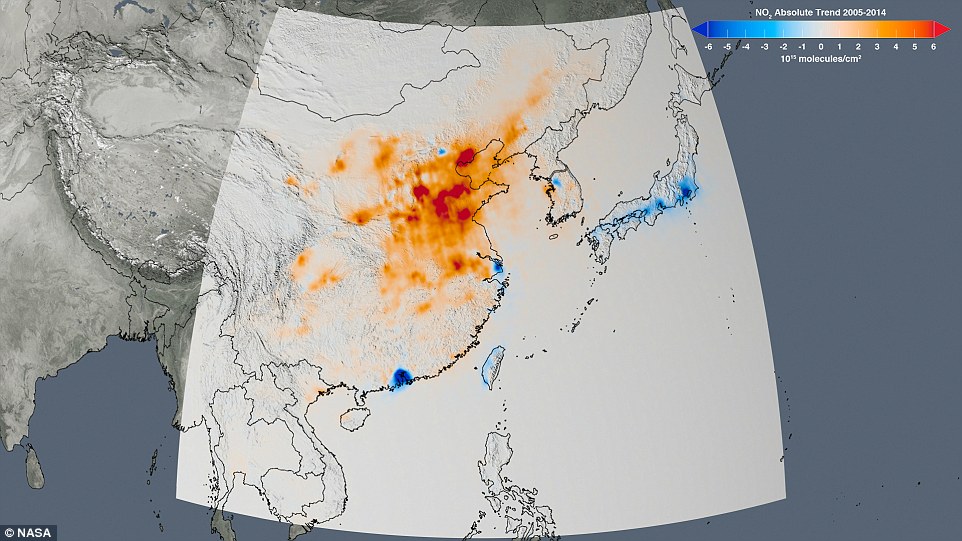 In this area, the trade winds are complex going to the west in the south (Honk Kong) and going to the east in the north of this map. So one could associate the warming over India as being part of the reduction in pollution from Hong Kong?Taiwan – and perhaps that directly to the east of Japan from similar reductions in Japan.
Note: all the above is based on the premise that REDUCING POLLUTION CAUSES WARMING (because pollution causes cooling).
SO2 emissions
I eventually found this graph from “Sulfur dioxide vertical column DOAS retrievals from the Ozone Monitoring Instrument: Global observations and comparison to ground-based and satellite data” and to enable comparison I will reproduce the Pause warming trend map.

Figure 7: Global distribution of SO2 columns from nearly clear-sky OMI measurements averaged for the 2004–2009 (same as ). Anthropogenic and volcanic emissions sources are visible. Note the presence of elevated SO2 values over clean regions at high latitudes due to residual interferences with ozone or the Ring effect.
 Comparing the graph with the the temperature trend, it is very clear that the NE of China hotspot lies in the “shadow” of the huge Chinese pollution seen in Satellite monitoring. It is also clear that there’s a massive SO2 source in the USSR which is similarly associated with warming in this location. There is also other SO2 emission in Arabia & the red sea which tentatively might explain at least some of the African warming. This graph and the very clear association of SO2 emmission are strong evidence that SO2 is having a WARMING effect.
Note: CURRENT POLLUTION IS HAVING A WARMING EFFECT
During a period of clear Chinese warming, with a very high level of SO2, we see a warming hotspot downwind.
Addendum:
I have now come across this graph showing that whilst China’s use of coal has been increasing, it’s SO2 emissions have been reducing. It is therefore possible in the period 2001-2011 that whilst coal use went up, there was a reduction in SO2 output.
This means that not only the wind directions from China but even the timing of pollutants is difficult to pin down. However, whilst there is definitely an effect – it is possible that SO2 emissions were reducing in the period of the relevant period. Thus the conclusion given the clear link between the plume of SO2 and the warming hotspot is “it clearly has an effect”, but whether it was an increase or decrease that caused the warming is uncertain.
Tracking down the Russian SO2
Given the general lack of industry in N.Russia, I thought I could track down what was causing this warming in the Arctic region of Russia because the mix of chemicals should be less complex. I found this:-
The city of Norilsk is very polluted because of its melting complexes. In the area, many chemical elements can be found (like Platinum, Nickel, Cobalt and more…) and this has reduced the life expectancy of about 10 years. This because of the sulfur dioxide (SO2) produced by factories here, which is very harmful for the human body. (source)
Conclusion
(Before SO2 graph)
Much if not most of the warming hotspots from 1985 as well as the Chinese cold spot during the pause correspond with known changes in economic activity and increases or decreases in pollution.
Even though we expect significant natural variation and some warming from CO2, the pattern is very compelling evidence requiring further investigation and strongly suggests that the reduction in previous cooling pollution was highly significant if not the main cause of recent temperature change.
(After SO2 graph)
The SO2 graph is strong evidence that recent SO2 has caused warming. This is now strong evidence that pollution causes both warming and cooling. Looking a wind map for the stratosphere today, the pollution in China extends down wind as the wind blows in the stratosphere.
I therefore suspect that the difference in effect is because some pollution is acting at a stratospheric level (causing warming) and some at a tropospheric level (causing cooling).
General Discussion
It seems I may have hit on both the cause of recent global warming as well as the reason it has not been identified as such. The reason is that pollution can have two very different effects causing both warming and cooling – probably depending at what height it interacts with clouds. Higher interaction (stratosphere?) may lead to warming and lower level may lead to cooling.
I am wondering whether the widespread use of coal burnt in houses may have created a very disperse pollutant that did not rise far or fast into the atmosphere. In contrast, looking at the picture, we see highly concentrated plumes of SO2 which appear to “punch through” the lower levels to a level where instead of creating cooling, they trap in heat and produce warming.
Persons note: No wonder we’ve been arguing about what caused warming!!




Pingback: Why climate models fail! | Scottish Sceptic