Following some very helpful comments to previous articles I am outlining the trigger mechanism in more detail and I want to go back to look at the reasons why we might have a relatively stable inter-glacial temperature.
See also:
- Introduction
- Criteria for Cycles
- Global warming and earthquakes
- Thermal crust expansion, decomposition and the Carbon cycle
- Overview of feedbacks
- Climate stability
- Hitting the buffers
- How CO2 could control climate
- Drying of climate
- 5million years of cycles
- Hadley Cells
- The Haseler Gap
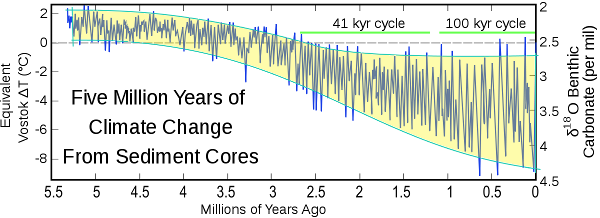
The reason I’m raising this again, is because I have not addressed the issue of why the climate might have started to go through ice-age cycles. Above, is the figure showing the progression of global temperature over the last 5million years. What is immediately obvious to me, is that the start of the “41kyr cycle” occurs coincident with the time the upper limit of the global temperature appears to dip below a threshold which is almost never exceeded once the climate is operating in this ice-age cycle.
I have not so far explained why this cycle should have started at this point. But first I would like to explain in more detail why we see the change from ~40k to ~100k year long cycles.
As has been mentioned in several previous articles, these cycles are coincident with changes in the Milankovitch cycle (at 65N). However, the Milankovitch cycle on its own is far too small to cause the ~8C warming we see between the glacial and inter-glacial part of the current ice-age.
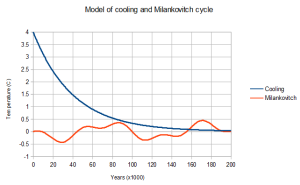
Fig 13.2 Model of exponential crustal cooling (blue) and simplified model of Milankovitch cycle (red)
Model
The model I am proposing is that after the warming as the world enters the inter-glacial, the world then slowly loses the heat as it penetrates the crust and is lost to space so that the crustal temperature tends to follow an exponential decline as showing in figure 13.2.
In addition the insolation (sunshine) onto the earth changes as a result of orbital changes in a regular pattern. I have simulated this pattern by combining a sin waves of periods 40,000 years and 100,000 years.
As stated earlier in Global warming and earthquakes, as the world cools the crust contracts in size and oceanic material is extruded. This process will continue until the crust begins to warm, it then expands and this initiates subduction, various emissions and catastrophic warming.
To show how this process is triggered by the Milankovitch cycle I have created a simple model combining the above exponential cooling with the simulated Milankovitch cycle to show how various scales of cycle and phases of the Cycle can result in a variety of cycle lengths.
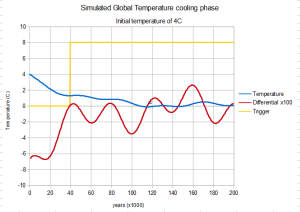
4C cooling amplitude
The above graph shows the modelled global cooling curve (blue) which is the combination of a exponential cooling curve from 4C and a simplified simulated Milankovitch cycle. Below in red is the differential (scaled x100). The cooling curve falls rapidly so that by 40,000 years after the cooling commenced, the rise in the Milankovitch curve is sufficient to overcome the rate of cooling so that we see warming (at some critical point in the crust) which then precipitates a new ice-age cycle.
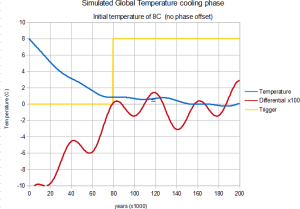
8C cooling amplitude
Above is a new curve showing cooling from 8C. This time the rate of cooling at the 40k Milankovitch peak is too great to overcome the faster rate of cooling and it is not until the 80k peak that the Milankovitch curve can overcome the rate of cooling and so trigger a new period of catastrophic warming.
8C cooling amplitude (change phase relationship between 40k and 100k)
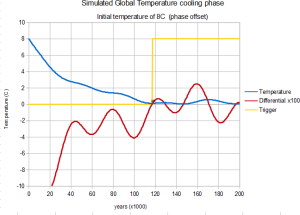
Fig13.5 Cooling starting from 8C (blue) & differential x100(red)
This time with a changed phase relationship between 40k and 100k in simple simulated Milankovitch cycle
Above is a new curve showing cooling from 8C but this time with a changed phase relationship between the 40k and 100k cycle. This simulates the same rate of cooling but at a later/earlier cycle when the change in time has resulted in a change in phase relationship between the 40k and 100k cycles of the simple simulated Milankovitch cycle. This time, because the Milankovitch cycle is smaller at 80k, the rate of cooling at both 40k & 80k is greater than the simulated Milankovitch cycle peak and it is not until the 120k peak that the Milankovitch curve can overcome the rate of cooling and so trigger a new period of catastrophic warming.
Explanation of change from random to 40k to 100k
This model explains why the ice-age cycle changes from 40k to approximately 100k as the size of the cooling cycle increases. This is because when the size of the cycle increase, the rate of cooling is sufficient to increase the the cycle delay from ~40k to around 80-120k years.
It also explain why the cycle is eratic in length and e.g. in fig 10.6 we see what appears to be a repeated change from a series of cycles followed by an irregular one and then another series. This is likely because the various components of the Milankovitch cycle cause the scale of the induced warming to vary so that on some cycles the Milankovitch warming is not sufficient to trigger catastrophic warming.
A likely explanation for the lack of regular cycles before million years is that the overall cooling cycle was too small to prevent Milankovitch or any other natural variation from triggering a new phase of warming. So, almost any natural variation would trigger a new round so causing the “cycle” to be random in nature.
What is causing the change in scale of cooling?
Central to this theory is the concept that the global temperature is triggered into a warming phase and then slowly cools again. The scale of this change appears to be the difference between a lower temperature which is slowly cooling for some reason and an upper temperature which appears to be constant.
Thus is appears that the the climate (before being triggered into warming) is subject to some form of cooling force which is driving the world toward ever colder temperature and presumably at some point in the future, the size of the cooling curve will be so large as to result in even longer ice-age cycles of around 160k years.
However, as I have not looked beyond 5million years, I would not like to say why this is happening. However others have mentioned various possibilities such as narrowing of particular seaways by plate movements, mountain building or even plant evolution resulting is plant species that dramatically reduce overall CO2 levels.
Upper threshold
The upper threshold appears to be an absolute temperature threshold and not relative to the lower temperature limit of the cycle. This suggests that this temperature represents some fundamental temperature change which occurs at this one temperature. Speculatively possible mechanisms are:
- Vegetative growth at a specific latitude
Plant growth is very dependent of ambient temperature. However this temperature varies strongly with latitude. However, if for some reason plant growth at one particular latitude were crucial to global climate and its presence or absence strongly affected global temperature, then it could create an absolute temperature theshold - Ice melt at a specific latitude
Likewise, if melting ice at a specific latitude strongly influenced climate then this could also act as an absolute temperature threshold. Possible example are sea ice in narrow straights which might effectively prevent ocean currents from passing these key points. - A.N.Other key temperature threshold.
For example, whilst it’s just a theoretical example, it is just conceivable that the 3/6 to 1/2 Hadley cell structure tend to occur at a particular temperature.
Evidence which seems to suggest the source comes in various forms
- First, there is the simple fact that we only have around 4 ice-age cycles in the Vostok core. This suggests that there was a massive melting event that finished around 420,000 years ago.
- Next is the apparent loss of ice layers around 240,000 years ago (see figure 1.2 in introduction). This suggests that the cycle is still very close to melting the ice layers at Vostok.
- Finally thanks to the comments so far received, the importance of ice in the “ICE-age” cycle has been highlighted. So whether ice is a cause or symptom, it does seem to play, or is a proxy for something with plays, a pivotal role in some way in the progression of the ice-age cycle.
Alternative and/or complementary Proposal for the upper “Buffer”
Therefore, in the absence of any other plausible or obvious absolute threshold that would cause something specific to happen at the temperature where the ice sheets are melting, I am therefore forced to suggest that the powerful negative feedback / loss of positive feedback is like to be the melting ice-sheets themselves.
Two possibilities spring to mind:
- That the melting ice-sheets directly absorb the heat.
- That is some way the melting of ice, perhaps particularly sea ice, creates a strong form of negative feedback which effectively prevents further warming.
However, what is worrying with scenario (2) is that the upper threshold is not a firm fixed threshold because quite clearly the climate has very often been above this threshold with no obvious limit coming into play.
So, it appears this threshold is itself one that can and does disappear from the system. As such the most likely explanation appears to be (1) above. That physical melting of the ice-sheets absorb heat.
Proposed mechanism
I have so far proposed that cloud formation was a potential mechanism for stopping further warming. However, whilst this may slow done warming, there is no obvious reason why it should create an absolute threshold temperature. Therefore I propose that it only slows down warming, not halts it.
Instead I now propose that the thermal expansion of the crust leads to increased plant growth and consequently to a more humid world. This more humid world has higher levels of water vapour which as a potent greenhouse gas (for more potent than CO2) effectively causes run-away warming.
However, as the warming progresses, these positive feedback effects diminish, but more importantly, the melting of the ice-sheets directly absorb masses of heat energy. This effectively prevents further warming, slowing down the crust expansion and eventually stabilising the crust so that subduction processes massively reduce and with it emissions of water vapour, CO2, SO2, dust and various other things with affect the climate both directly and indirectly.
Thus the melting of the massive ice-sheets which are over a mile thick, which form as far south as Britain, effectively halt further warming sufficiently long to halt crustal expansion. Then various processes start to lock up CO2. Plant growth decreases, the release of water vapour drops and the crust starts to contract reducing still further atmospheric emissions from volcanoes (many of which are plant nutrients).
This then allows the build up of ice-sheets, the globe cools, eventually the amount of CO2 is so low that natural processes cannot effectively lock up the CO2 and reducing atmospheric levels. We reach another near-equilibrium state with very modest cooling, where a small amount of additional warming from the Milankovitch cycle (over a period of time) can start to warm the crust, cause expansion and precipitate us into another warming event into the inter-glacial.
See also:

