Across at uBurns.com, a slow trickle of people have been looking at the page giving me a total of 221 page views. So, I thought there was enough data to do some preliminary stats.
First to recap: the climatic temperature data has a 1/f frequency response showing that natural variation can be modelled by 1/f noise. So assuming all the variation is natural we should be able to model climate with 1/f noise. But little has been written on the statistics of 1/f so it is difficult to know how it will behave. So, I have created a simple 1/f noise generator at uBurns.com and am using this to get data.
To do this, I’ve split the 1000 or so data points of each trial into 16 “buckets” and recorded the average value and slope of each bucket for each trial.
The predictions I made were as follows:
Variance increases proportional to square root.

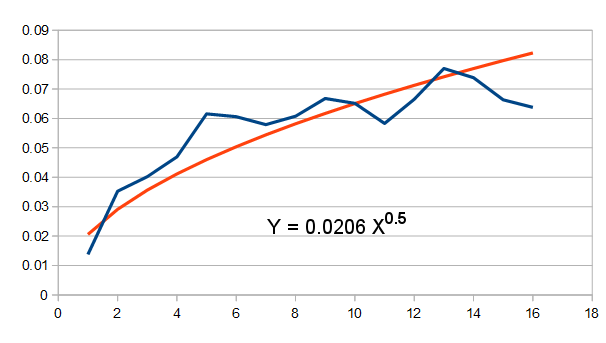
As predicted the variance (sum of squares) of the 1/f noise (shown above in blue) increases with each successive “bucket” so that the increase is proportionate to the square root of the number of points (or in this case buckets). It’s not a perfect fit, but it looks like it’s heading that way.
The trend tends to be downward when the value is high and tends to be upward when the value is low

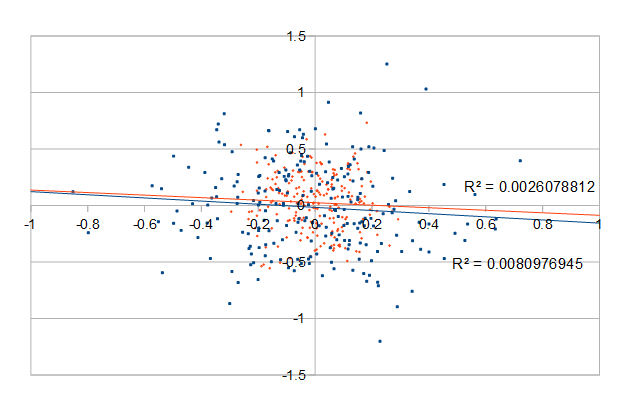
Shown above is a scatter for values of trend and average value for the first bucket of points (orange R2 = 0.0026) and the last bucket (blue R2 = 0.0080). As a low R2 value means the two are unrelated, there is clearly no relationship between the average value of the 1/f noise and the trend. So high values do not tend to slope down.
 This is not what I expected. With Gaussian white noise, if we happen to have a high value for one value, then because the bulk of the distribution is lower, we expect to get a low value at the next reading.
Because the 1/f simulator uses a number of Gaussian white noise generators, whereby each is effectively operating at half the speed, I assumed, the sum would have the same general properties whereby a higher value would be expected in general to be followed by a lower value. Clearly this is not true.
Implications for temperature forecast
As such, the fact we have an unusually high temperature (most likely overwhelmingly from natural variation), does not in itself mean that the next movement would be downward.
However, that can only be a tentative finding as I will need to convince myself that I understand why before being certain this is the case.


Pingback: Introduction to 1/f climate noise | Scottish Sceptic
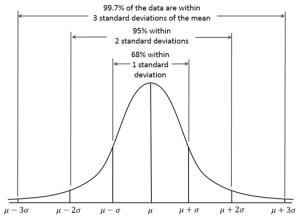
the implication is that 1/f noise does not follow the central limit theorem, and thus climate cannot be expected to converge to a mean over time.
the implications are profound, as it means that the ensemble mean of the climate models will not follow a normal distribution.
Thanks ferd. And I think your conclusion is correct – however I don’t really feel I understand the subject as well as I would like.
My original assumption is that it would tend to return back toward a central value and that only a random walk would fail to return, however the model of random noise I am using does not appear to have the property of returning.
However, there is no real understanding of why we have 1/f type noise and so I cannot be certain that the properties of the random noise generator I have is typical.
My hunch from the frequency spectrum is that fundamentally 1/f noise stems from an ensemble of step like changes (in semiconductors one concept is that channels open and close). The reason is that a step has this 1/f function and so a random ensemble will also have the same frequency profile.
However, real 1/f type noise comes in a range of colours as it is really 1/f^n where 0->n->2
That suggests a range of random contributions from delta functions (1/f^0) to step (1/f) to some form of exp(-x) (1/f^2)
But where n is 2, it is a random walk., where n is 0 it is white noise. So, by a hand waving argument 1/f type noise should be somewhere between the two with properties in betweeen.
One possibility I am considering is that values in the centre tend to be like a random walk, whereas extreme values tend toward the centre. So, perhaps a very few extreme values hedge in the values.
But for me the big problem is that 1/f type noise is defined by its spectrum, whereas I’m trying to understand its statistical properties – so that e.g. we know how a climate signal with a 1/f type signature will behave.
Pingback: What Are The Chances Of Getting All These “Record” “Hot” Years? | Scottish Sceptic