Every so often I go and have a look at the global warming search term trends to see how things are going. This time I’ve collected them together.
The general overview of searches
Below is an overview of the trend since 2004 till present on the search terms “global warming”, “Greenhouse gas”, “”climate change”, “climategate” and for comparison “antarctic”.
First, taking the term “Antarctic”, we see that there is a general trend for search volumes to decrease with time, although as we are not told what exactly this figure means, it is likely it means that the relative importance of the term “Antarctic” has declined.
So, the rise in “Global warming” is just phenomenal from 2004 till 2007 when it clearly peaked. Whilst if we look closely we can also see that “greenhouse gas” and “climate change” had a temporary peak in 2007, their relative decline since 2007 is smaller.
Climategate
Something which shows up quite clearly, particularly in “Climate change” and “Greenhouse gas” is Climategate.” However, it is surprising how relatively small the effect was on the search term “Global warming”. Perhaps this is because “global warming” had already seen a massive decline in public interest which far outdwarfed the scandal of Climategate.
Whatever the truth, whilst for those of us involved it may have seemed huge (I created the petition asking for the investigations), the reality is that climategate was just a temporary reprieve in public interest.
Yearly Cycle
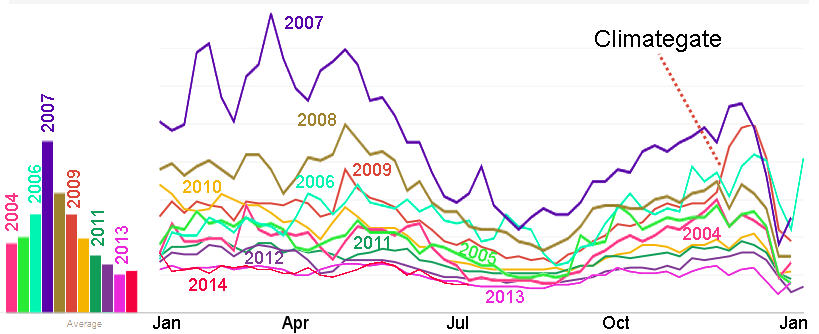
Yes, if you have been wondering, there is a pronounced yearly cycle to the “global warming” search term. And “term” may well be right in two of its meanings.
Because the scale of searching seems to closely follow the academic year. The Xmas break is clearly seen. Then around June/July as we enter the exam period, the number of searches decrease until it reaches another low at the hottest time of the year, so a time if common sense had anything to do with it we would expect a peak. And then when the young minds return to the classroom to be indoctrinated again, we see a rise. Or perhaps we should conclude:
Interest in global warming peaks in colder months!
Unfortunately, not all the world has the same winter months. But it isn’t possible using Google trends to select out only northern countries, so instead I’ve selected out the long term trend and plotted below:
Now the trend is even stronger and for example on the UK (red) line we often seen two distinct dips corresponding to the Easter and summer school holidays.
Global warming is climate related!
And of course the irony is that the global warming search cycle is clearly climate related as the following two plots show:

“Global warming” search trend for US, Australia and India showing distinct differences in cycle. (Notes date centred mid year)
To understand this, first look at the blue line (US) which shows the typical Northern cycle. Then compare this to India (red). Notice how in 2007/2008, there is a strong yearly trend but this is out of phase with the US. I presume this is because of their monsoon climate. Next look at the orange and see how the lowest dips coincide with the US small “summer dip”.
To show that this is climatic, below I’ve plotted the three big southern hemisphere English speaking countries: Australia, S.Africa and New Zealand.

“Global warming” search trends for southern hemisphere English speaking countries of Australia, S.Africa and New Zealand. (Note dates centred mid year)
Australia and New Zealand are culturally very similar and geographically relatively close. So, perhaps the strongest evidence is the close similarity between S.Africa and this pair. Again these southern nations have their strongest dip in June/July in contrast to the Northern states dip in December/January.
Interest in global warming peaks in colder months!


