Original Questions
For reference here are the original questions
Introduction
In Early 2014 following an article “Sceptics Versus Academics” Mike Haseler & the Scottish Climate & Energy Forum (SCEF) conducted an on line survey of the participants of the online climate debate.
With only around 100 responses expected, the survey was intended to get qualitative information from a low sample for which a simple spreadsheet would be adequate. As it turned out over 5000 surveys were completed.
“We knew we had problems when the spreadsheet intended to analyse the results refused to open the data download” said Mike Haseler then Chair of SCEF. There is a huge amount that can and should be teased out of this data.
“So we approached both the UK and Scottish government for help to complete the analysis of the survey and publish the results. Despite regularly making false statements about us sceptics, neither government were interested in the facts.”
SCEF also approached the few academics who had showed themselves to be impartial and not part of the regular attacks against climate sceptics but none could help.
A year later, with no sign of the necessary funding to do a proper statistical analysis Mike Haseler feels that is is time to release the raw report that as is.
Please note this report uses the full dataset and e.g. it has not been possible to remove a couple of dozen “test” responses. However the number is small enough not to change the main results.
Statistics
| Results | |
|---|---|
| Number of records in this query: | 6496 |
| Total records in survey: | 6496 |
| Percentage of total: | 100.00% |
| Field summary for I001 | |||
|---|---|---|---|
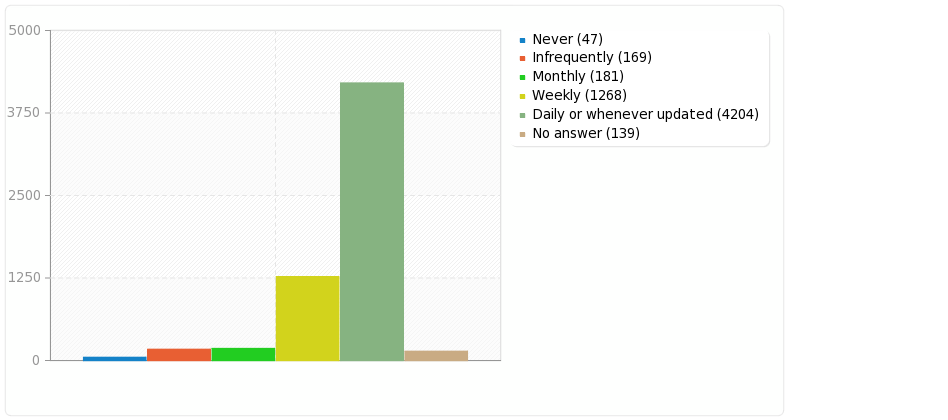
| How often do you read “sceptic” blogs which are generally sceptical of manmade warming such as Watts Up With That, Climate Depot, Harmless Sky, The GWPF, Jo Nova, Climate Audit, Stephen Goddard, Bishop Hill, Tallbloke’s Talkshop, EIKE, etc. |
|||
| Answer | Count | Percentage | |
| Never (1) | 47 | 0.78% | |
| Infrequently (2) | 169 | 2.81% | |
| Monthly (3) | 181 | 3.01% | |
| Weekly (4) | 1268 | 21.11% | |
| Daily or whenever updated (5) | 4204 | 69.97% | |
| No answer | 139 | 2.31% | |
 |
|||
| Field summary for I002 | |||
|---|---|---|---|
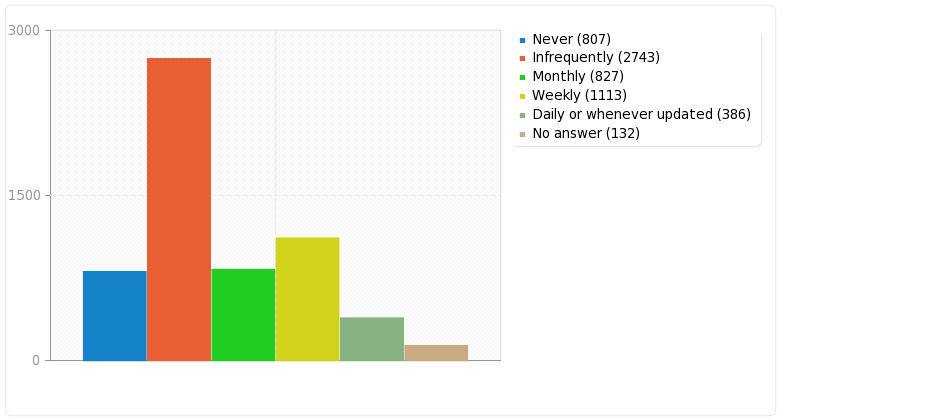
| How often do you read blogs that are in general convinced that manmade warming is a problem such as Skeptical Science, Real Climate, DeSmogBlog, Celsias, George Monbiot, The Carbon Brief, Cliff Mass, Tamino’s Open Mind, Climate Ark or Hotwhopper, etc. |
|||
| Answer | Count | Percentage | |
| Never (1) | 807 | 13.43% | |
| Infrequently (2) | 2743 | 45.66% | |
| Monthly (3) | 827 | 13.76% | |
| Weekly (4) | 1113 | 18.53% | |
| Daily or whenever updated (5) | 386 | 6.42% | |
| No answer | 132 | 2.20% | |
 |
|||
| Field summary for Q27 | |||
|---|---|---|---|
| What subjects would you like to see covered more or in more detail on the climate blogs? | |||
| Count | Percentage | ||
| Answer | 3923 | 68.19% | |
| No answer | 1830 | 31.81% | |
| Field summary for Q01 | |||
|---|---|---|---|
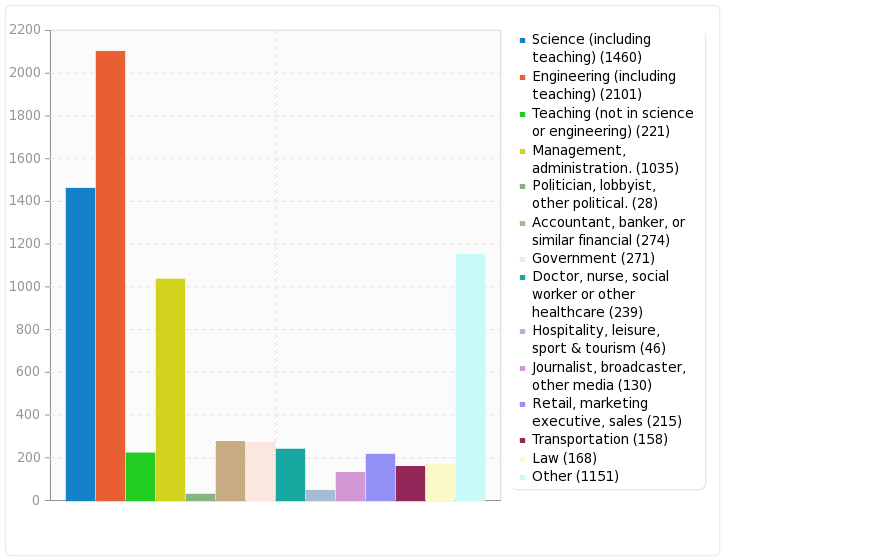
| What has been your main working occupation? | |||
| Answer | Count | Percentage | |
| Science (including teaching) (A02) | 1460 | 25.58% | |
| Engineering (including teaching) (A03) | 2101 | 36.81% | |
| Teaching (not in science or engineering) (A04) | 221 | 3.87% | |
| Management, administration. (A05) | 1035 | 18.14% | |
| Politician, lobbyist, other political. (A06) | 28 | 0.49% | |
| Accountant, banker, or similar financial (A07) | 274 | 4.80% | |
| Government (A08) | 271 | 4.75% | |
| Doctor, nurse, social worker or other healthcare (A09) | 239 | 4.19% | |
| Hospitality, leisure, sport & tourism (A10) | 46 | 0.81% | |
| Journalist, broadcaster, other media (A11) | 130 | 2.28% | |
| Retail, marketing executive, sales (A12) | 215 | 3.77% | |
| Transportation (A13) | 158 | 2.77% | |
| Law (A14) | 168 | 2.94% | |
| Other | 1151 | 20.17% | |
 |
|||
| Field summary for Q02 | |||
|---|---|---|---|
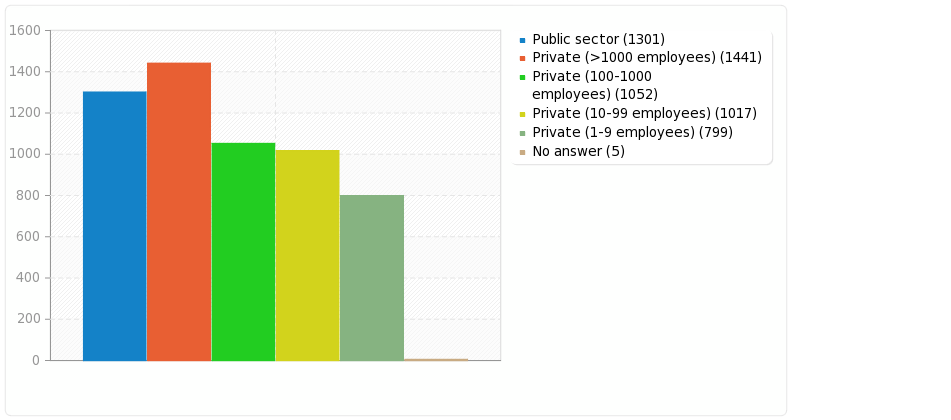
| Where have you mainly worked? | |||
| Answer | Count | Percentage | |
| Public sector (1) | 1301 | 23.17% | |
| Private (>1000 employees) (2) | 1441 | 25.66% | |
| Private (100-1000 employees) (3) | 1052 | 18.74% | |
| Private (10-99 employees) (4) | 1017 | 18.11% | |
| Private (1-9 employees) (5) | 799 | 14.23% | |
| No answer | 5 | 0.09% | |
 |
|||
| Field summary for Q03 | |||
|---|---|---|---|
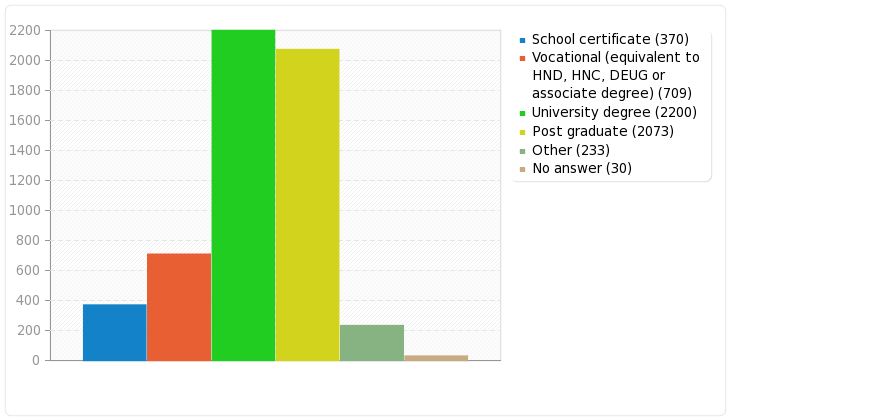
| What is the highest level of qualifications you hold? | |||
| Answer | Count | Percentage | |
| School certificate (1) | 370 | 6.59% | |
| Vocational (equivalent to HND, HNC, DEUG or associate degree) (2) | 709 | 12.63% | |
| University degree (3) | 2200 | 39.18% | |
| Post graduate (4) | 2073 | 36.92% | |
| Other | 233 | 4.15% | |
| No answer | 30 | 0.53% | |
 |
|||
| Field summary for Q04 | |||
|---|---|---|---|
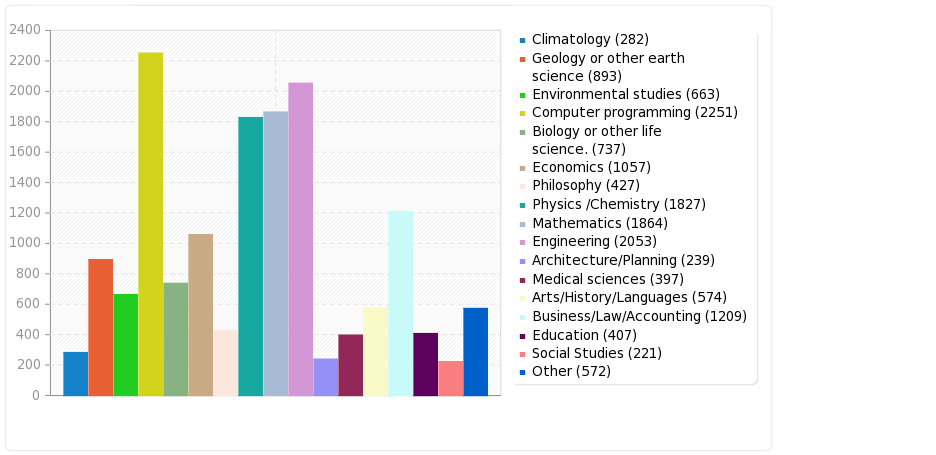
| Please tick any of the following areas where you have received formal post-school education or training | |||
| Answer | Count | Percentage | |
| Climatology (a05) | 282 | 5.04% | |
| Geology or other earth science (a01) | 893 | 15.97% | |
| Environmental studies (a02) | 663 | 11.86% | |
| Computer programming (a03) | 2251 | 40.27% | |
| Biology or other life science. (a06) | 737 | 13.18% | |
| Economics (a07) | 1057 | 18.91% | |
| Philosophy (a08) | 427 | 7.64% | |
| Physics /Chemistry (a09) | 1827 | 32.68% | |
| Mathematics (a10) | 1864 | 33.35% | |
| Engineering (1) | 2053 | 36.73% | |
| Architecture/Planning (2) | 239 | 4.28% | |
| Medical sciences (3) | 397 | 7.10% | |
| Arts/History/Languages (4) | 574 | 10.27% | |
| Business/Law/Accounting (5) | 1209 | 21.63% | |
| Education (6) | 407 | 7.28% | |
| Social Studies (7) | 221 | 3.95% | |
| Other | 572 | 10.23% | |
 |
|||
| Field summary for Q05 | |||
|---|---|---|---|
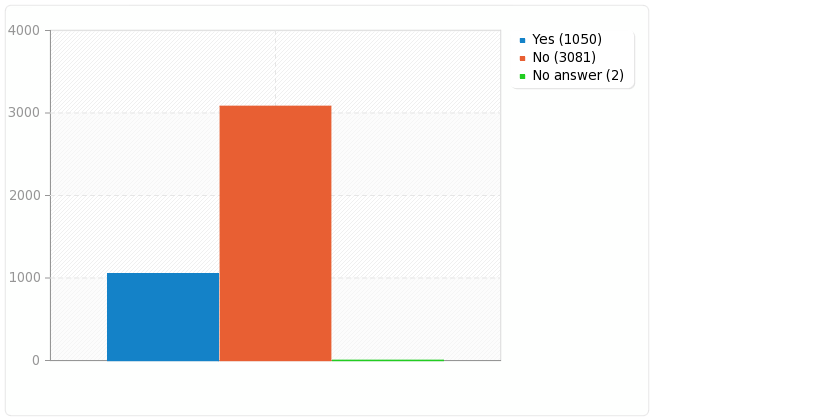
| Have you worked in science for more than one year? | |||
| Answer | Count | Percentage | |
| Yes (Y) | 1050 | 25.41% | |
| No (N) | 3081 | 74.55% | |
| No answer | 2 | 0.05% | |
 |
|||
| Field summary for Q06 | |||
|---|---|---|---|
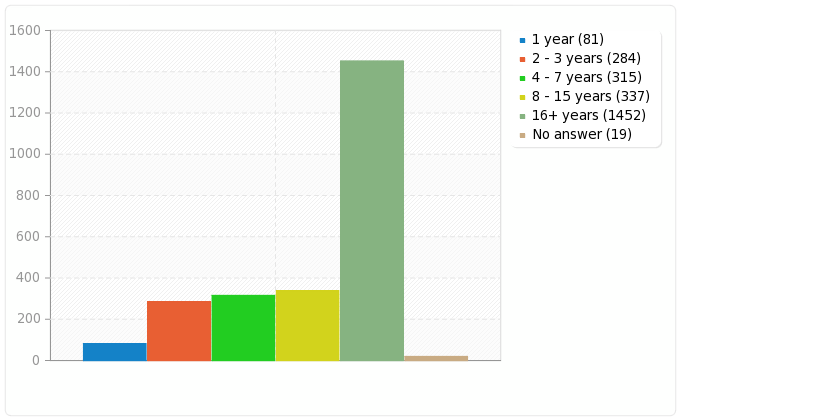
| How many years have you worked in science | |||
| Answer | Count | Percentage | |
| 1 year (1) | 81 | 3.26% | |
| 2 – 3 years (2) | 284 | 11.41% | |
| 4 – 7 years (3) | 315 | 12.66% | |
| 8 – 15 years (4) | 337 | 13.55% | |
| 16+ years (5) | 1452 | 58.36% | |
| No answer | 19 | 0.76% | |
 |
|||
| Field summary for Q07 | |||
|---|---|---|---|
| Which of the following areas of science have you worked in for at least a year? | |||
| Answer | Count | Percentage | |
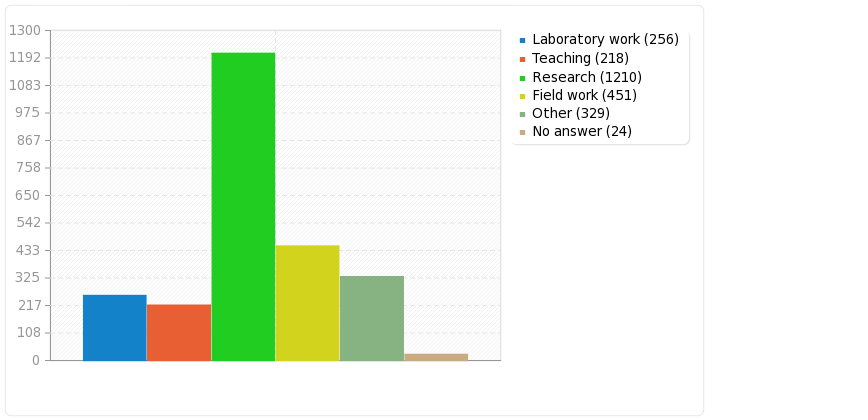
| Laboratory work (1) | 256 | 10.29% | |
| Teaching (2) | 218 | 8.76% | |
| Research (3) | 1210 | 48.63% | |
| Field work (4) | 451 | 18.13% | |
| Other | 329 | 13.22% | |
| No answer | 24 | 0.96% | |
 |
|||
| Field summary for Q08 | |||
|---|---|---|---|
| Have you worked in engineering for more than one year? | |||
| Answer | Count | Percentage | |
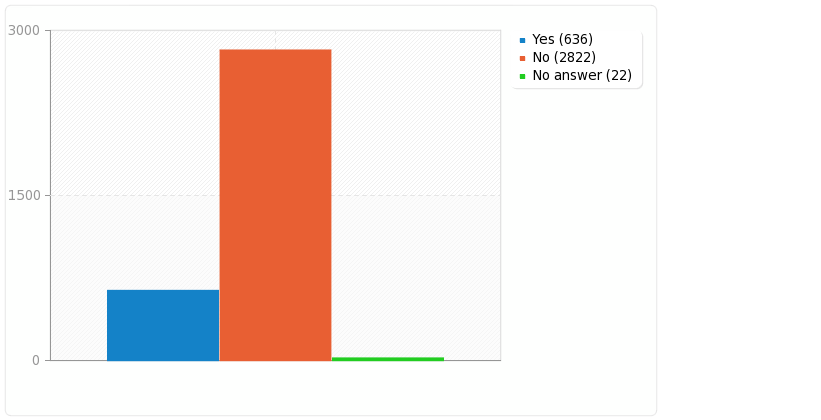
| Yes (Y) | 636 | 18.28% | |
| No (N) | 2822 | 81.09% | |
| No answer | 22 | 0.63% | |
 |
|||
| Field summary for Q09 | |||
|---|---|---|---|
| How many years have you worked in Engineering | |||
| Answer | Count | Percentage | |
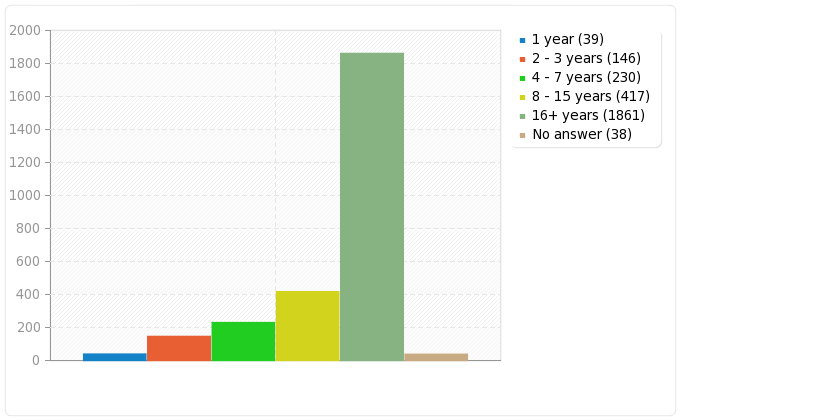
| 1 year (1) | 39 | 1.43% | |
| 2 – 3 years (2) | 146 | 5.35% | |
| 4 – 7 years (3) | 230 | 8.42% | |
| 8 – 15 years (4) | 417 | 15.27% | |
| 16+ years (5) | 1861 | 68.14% | |
| No answer | 38 | 1.39% | |
 |
|||
| Field summary for Q10 | |||
|---|---|---|---|
| Which of the following engineering areas have you worked in for at least a year? | |||
| Answer | Count | Percentage | |
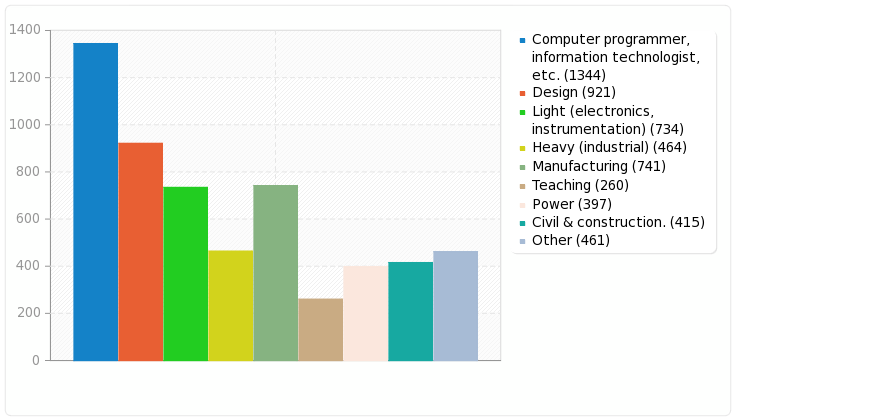
| Computer programmer, information technologist, etc. (1) | 1344 | 49.21% | |
| Design (2) | 921 | 33.72% | |
| Light (electronics, instrumentation) (3) | 734 | 26.88% | |
| Heavy (industrial) (4) | 464 | 16.99% | |
| Manufacturing (5) | 741 | 27.13% | |
| Teaching (6) | 260 | 9.52% | |
| Power (7) | 397 | 14.54% | |
| Civil & construction. (8) | 415 | 15.20% | |
| Other | 461 | 16.88% | |
 |
|||
| Field summary for Q12(1) | |||
|---|---|---|---|
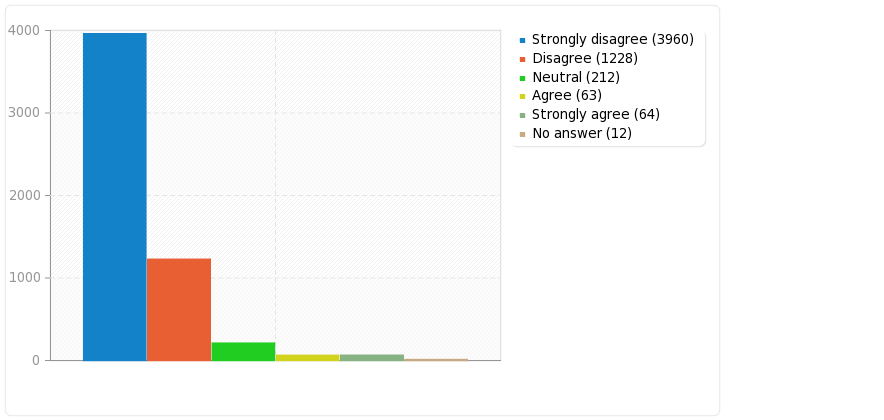
| Please say whether you agree or disagree with the following statements[CO2 will cause catastrophic global warming] | |||
| Answer | Count | Percentage | |
| Strongly disagree (J1) | 3960 | 71.49% | |
| Disagree (J2) | 1228 | 22.17% | |
| Neutral (J3) | 212 | 3.83% | |
| Agree (J4) | 63 | 1.14% | |
| Strongly agree (J5) | 64 | 1.16% | |
| No answer | 12 | 0.22% | |
 |
|||
| Field summary for Q12(2) | |||
|---|---|---|---|
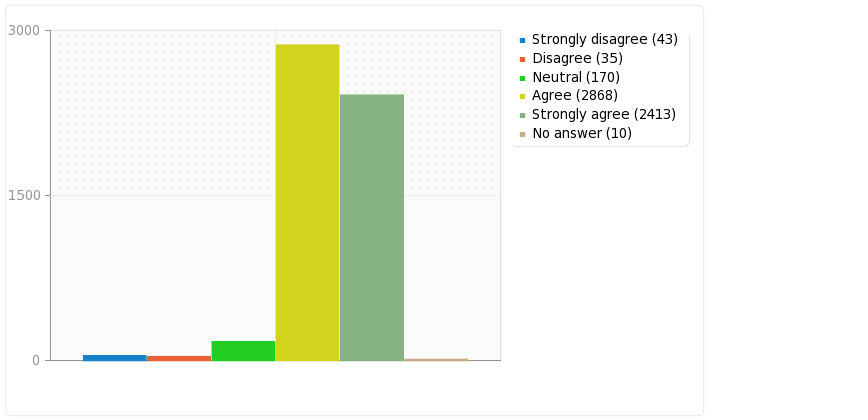
| Please say whether you agree or disagree with the following statements[The level of CO2 in the atmosphere is increasing] | |||
| Answer | Count | Percentage | |
| Strongly disagree (J1) | 43 | 0.78% | |
| Disagree (J2) | 35 | 0.63% | |
| Neutral (J3) | 170 | 3.07% | |
| Agree (J4) | 2868 | 51.78% | |
| Strongly agree (J5) | 2413 | 43.56% | |
| No answer | 10 | 0.18% | |
 |
|||
| Field summary for Q12(3) | |||
|---|---|---|---|
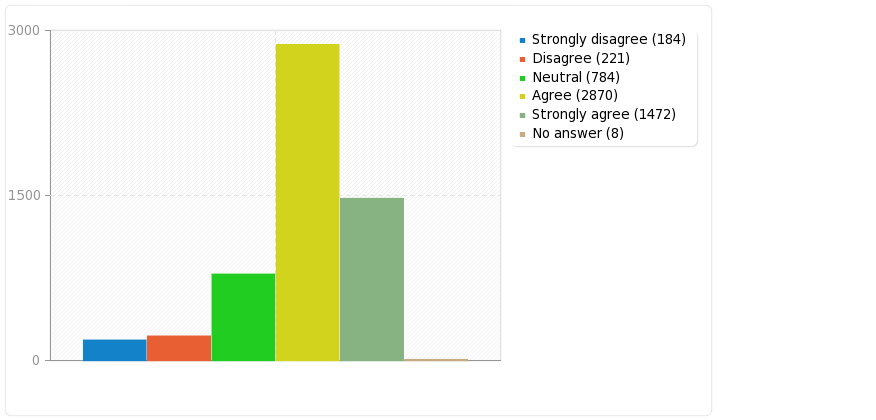
| Please say whether you agree or disagree with the following statements[Man-made sources have increased global levels of CO2] | |||
| Answer | Count | Percentage | |
| Strongly disagree (J1) | 184 | 3.32% | |
| Disagree (J2) | 221 | 3.99% | |
| Neutral (J3) | 784 | 14.15% | |
| Agree (J4) | 2870 | 51.81% | |
| Strongly agree (J5) | 1472 | 26.58% | |
| No answer | 8 | 0.14% | |
 |
|||
| Field summary for Q12(4) | |||
|---|---|---|---|
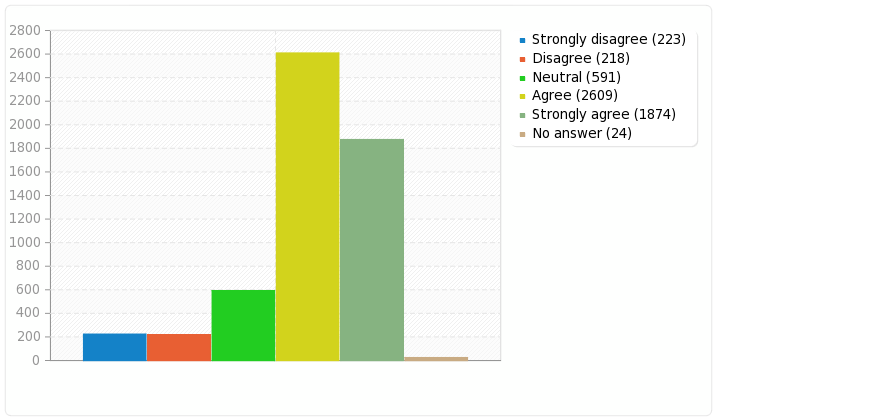
| Please say whether you agree or disagree with the following statements[CO2 is a greenhouse gas.] | |||
| Answer | Count | Percentage | |
| Strongly disagree (J1) | 223 | 4.03% | |
| Disagree (J2) | 218 | 3.94% | |
| Neutral (J3) | 591 | 10.67% | |
| Agree (J4) | 2609 | 47.10% | |
| Strongly agree (J5) | 1874 | 33.83% | |
| No answer | 24 | 0.43% | |
 |
|||
| Field summary for Q12(5) | |||
|---|---|---|---|
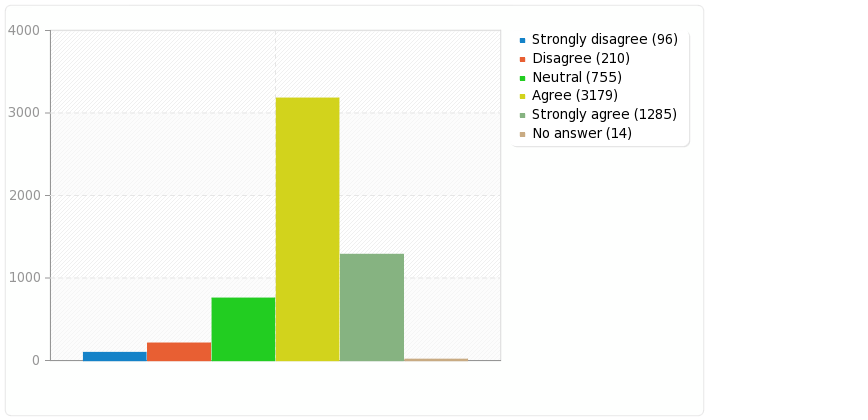
| Please say whether you agree or disagree with the following statements[Over the 20th century there was warming of average global temperatures] | |||
| Answer | Count | Percentage | |
| Strongly disagree (J1) | 96 | 1.73% | |
| Disagree (J2) | 210 | 3.79% | |
| Neutral (J3) | 755 | 13.63% | |
| Agree (J4) | 3179 | 57.39% | |
| Strongly agree (J5) | 1285 | 23.20% | |
| No answer | 14 | 0.25% | |
 |
|||
| Field summary for Q12(6) | |||
|---|---|---|---|
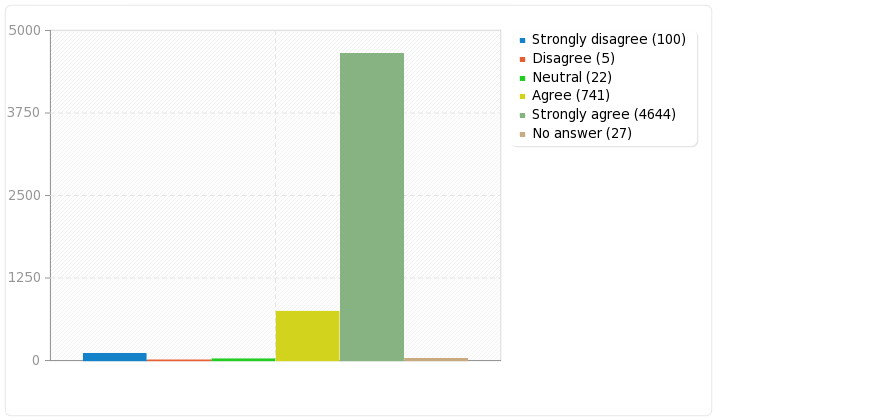
| Please say whether you agree or disagree with the following statements[Climate varies naturally] | |||
| Answer | Count | Percentage | |
| Strongly disagree (J1) | 100 | 1.81% | |
| Disagree (J2) | 5 | 0.09% | |
| Neutral (J3) | 22 | 0.40% | |
| Agree (J4) | 741 | 13.38% | |
| Strongly agree (J5) | 4644 | 83.84% | |
| No answer | 27 | 0.49% | |
 |
|||
| Field summary for Q13(1) | |||
|---|---|---|---|
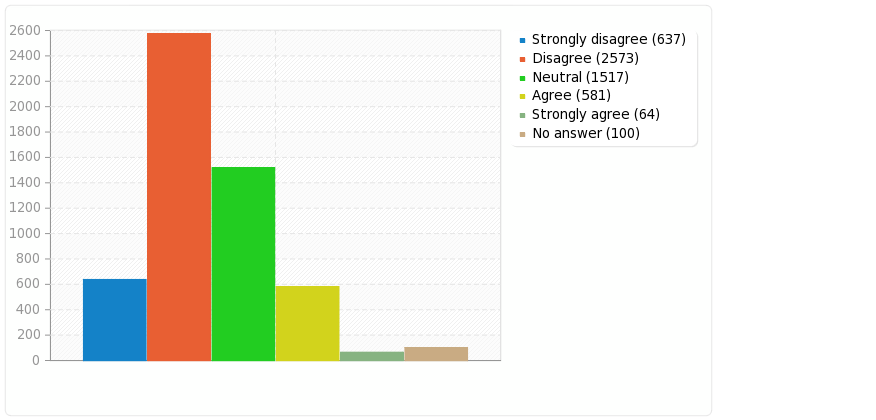
| Please indicate how strongly you agree with the following statements about your most recent job.[I do not to like to stand out or be unconventional.] | |||
| Answer | Count | Percentage | |
| Strongly disagree (J1) | 637 | 11.64% | |
| Disagree (J2) | 2573 | 47.02% | |
| Neutral (J3) | 1517 | 27.72% | |
| Agree (J4) | 581 | 10.62% | |
| Strongly agree (J5) | 64 | 1.17% | |
| No answer | 100 | 1.83% | |
 |
|||
| Field summary for Q13(2) | |||
|---|---|---|---|
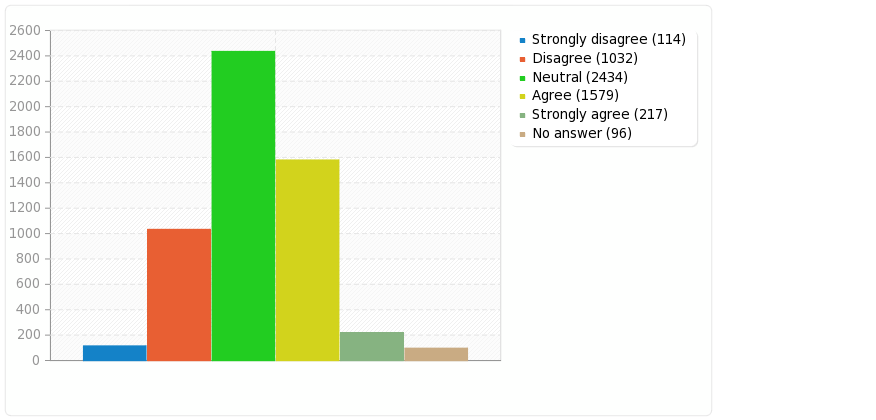
| Please indicate how strongly you agree with the following statements about your most recent job.[I prefer to work as part of a group] | |||
| Answer | Count | Percentage | |
| Strongly disagree (J1) | 114 | 2.08% | |
| Disagree (J2) | 1032 | 18.86% | |
| Neutral (J3) | 2434 | 44.48% | |
| Agree (J4) | 1579 | 28.86% | |
| Strongly agree (J5) | 217 | 3.97% | |
| No answer | 96 | 1.75% | |
 |
|||
| Field summary for Q13(3) | |||
|---|---|---|---|
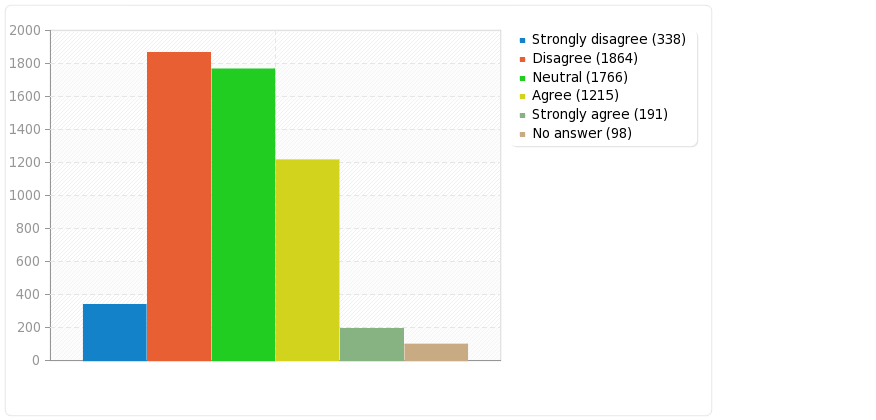
| Please indicate how strongly you agree with the following statements about your most recent job.[At work, I often take over projects and steer them my way without worrying about what other people think] | |||
| Answer | Count | Percentage | |
| Strongly disagree (J1) | 338 | 6.18% | |
| Disagree (J2) | 1864 | 34.06% | |
| Neutral (J3) | 1766 | 32.27% | |
| Agree (J4) | 1215 | 22.20% | |
| Strongly agree (J5) | 191 | 3.49% | |
| No answer | 98 | 1.79% | |
 |
|||
| Field summary for Q13(4) | |||
|---|---|---|---|
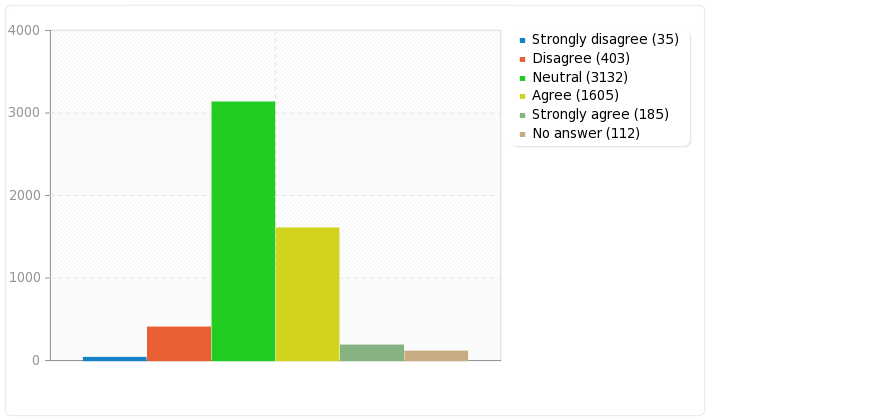
| Please indicate how strongly you agree with the following statements about your most recent job.[My colleagues should work together more] | |||
| Answer | Count | Percentage | |
| Strongly disagree (J1) | 35 | 0.64% | |
| Disagree (J2) | 403 | 7.36% | |
| Neutral (J3) | 3132 | 57.24% | |
| Agree (J4) | 1605 | 29.33% | |
| Strongly agree (J5) | 185 | 3.38% | |
| No answer | 112 | 2.05% | |
 |
|||
| Field summary for Q13(5) | |||
|---|---|---|---|
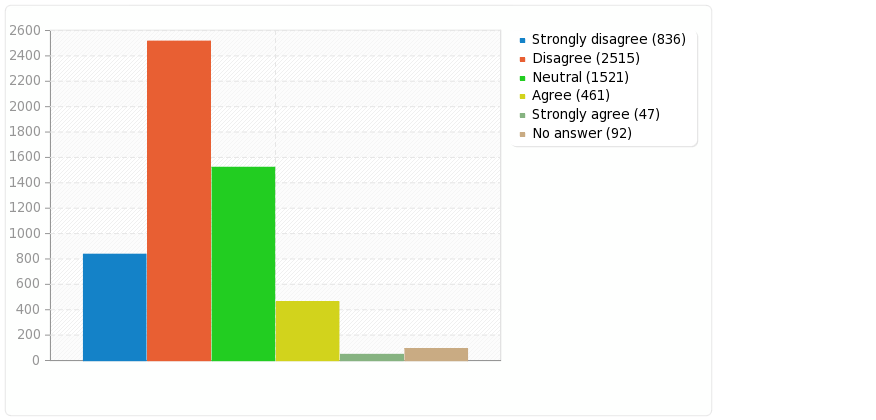
| Please indicate how strongly you agree with the following statements about your most recent job.[I like a lot of guidance so that I am very clear about what to do in work.] | |||
| Answer | Count | Percentage | |
| Strongly disagree (J1) | 836 | 15.28% | |
| Disagree (J2) | 2515 | 45.96% | |
| Neutral (J3) | 1521 | 27.80% | |
| Agree (J4) | 461 | 8.42% | |
| Strongly agree (J5) | 47 | 0.86% | |
| No answer | 92 | 1.68% | |
 |
|||
| Field summary for Q13(6) | |||
|---|---|---|---|
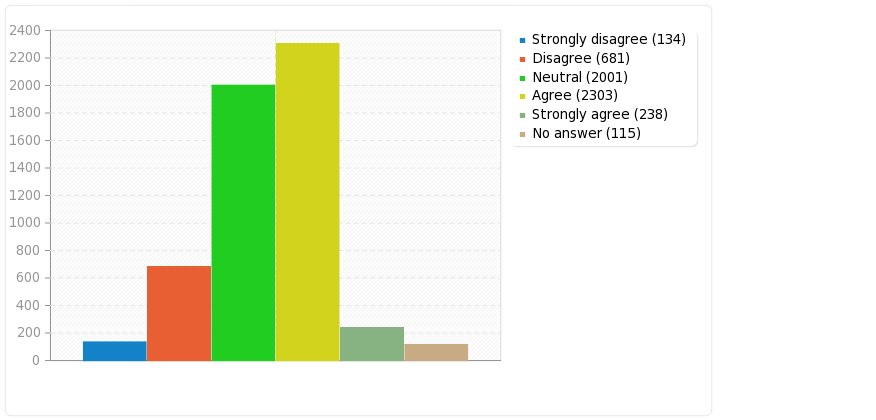
| Please indicate how strongly you agree with the following statements about your most recent job.[I sometimes tell others to stop thinking negatively about their work] | |||
| Answer | Count | Percentage | |
| Strongly disagree (J1) | 134 | 2.45% | |
| Disagree (J2) | 681 | 12.45% | |
| Neutral (J3) | 2001 | 36.57% | |
| Agree (J4) | 2303 | 42.09% | |
| Strongly agree (J5) | 238 | 4.35% | |
| No answer | 115 | 2.10% | |
 |
|||
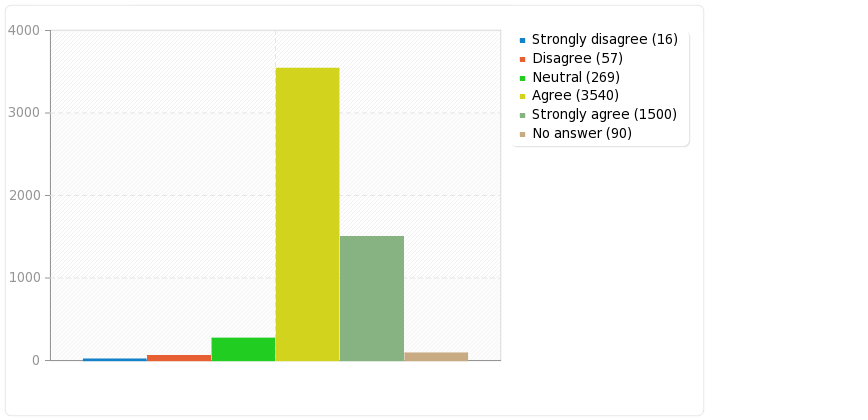
| Field summary for Q13(7) | |||
|---|---|---|---|
| Please indicate how strongly you agree with the following statements about your most recent job.[I usually know what is needed to be done at work] | |||
| Answer | Count | Percentage | |
| Strongly disagree (J1) | 16 | 0.29% | |
| Disagree (J2) | 57 | 1.04% | |
| Neutral (J3) | 269 | 4.92% | |
| Agree (J4) | 3540 | 64.69% | |
| Strongly agree (J5) | 1500 | 27.41% | |
| No answer | 90 | 1.64% | |
 |
|||
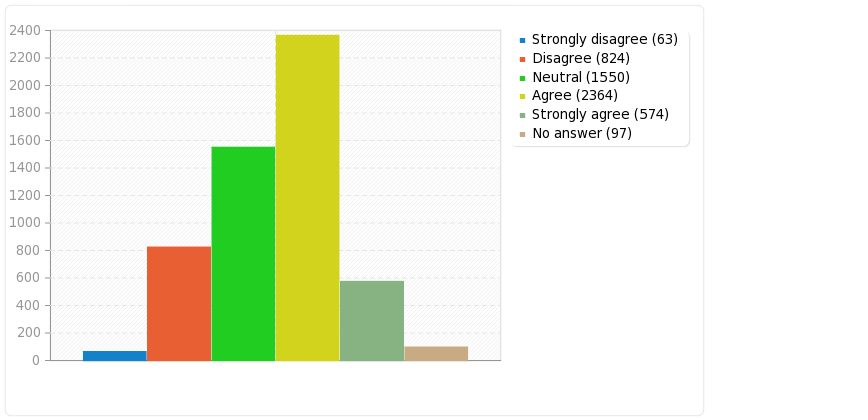
| Field summary for Q13(8) | |||
|---|---|---|---|
| Please indicate how strongly you agree with the following statements about your most recent job.[I rarely need or want any assistance and like to put my own stamp on work that I do.] | |||
| Answer | Count | Percentage | |
| Strongly disagree (J1) | 63 | 1.15% | |
| Disagree (J2) | 824 | 15.06% | |
| Neutral (J3) | 1550 | 28.33% | |
| Agree (J4) | 2364 | 43.20% | |
| Strongly agree (J5) | 574 | 10.49% | |
| No answer | 97 | 1.77% | |
 |
|||
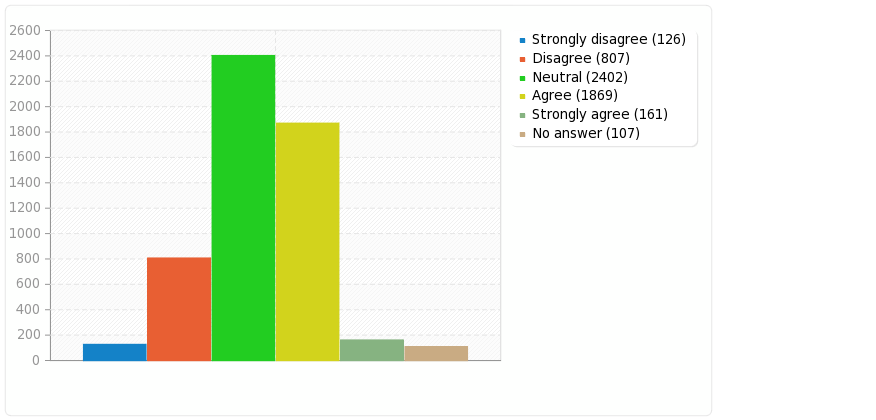
| Field summary for Q13(9) | |||
|---|---|---|---|
| Please indicate how strongly you agree with the following statements about your most recent job.[It is important colleagues say they appreciate my work] | |||
| Answer | Count | Percentage | |
| Strongly disagree (J1) | 126 | 2.30% | |
| Disagree (J2) | 807 | 14.75% | |
| Neutral (J3) | 2402 | 43.90% | |
| Agree (J4) | 1869 | 34.16% | |
| Strongly agree (J5) | 161 | 2.94% | |
| No answer | 107 | 1.96% | |
 |
|||
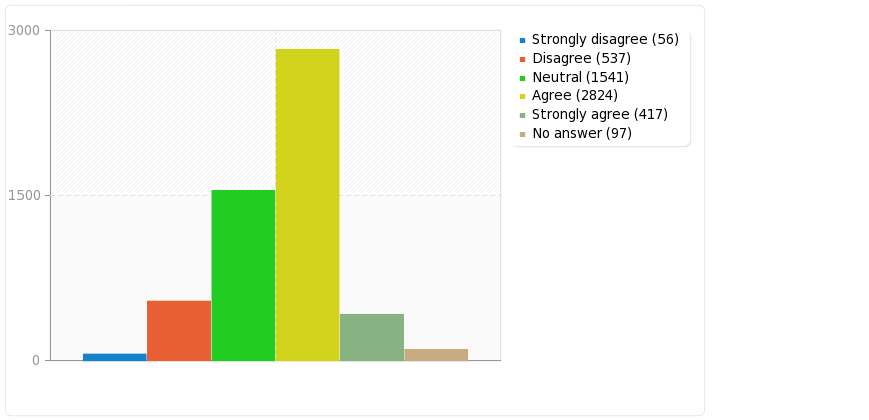
| Field summary for Q13(10) | |||
|---|---|---|---|
| Please indicate how strongly you agree with the following statements about your most recent job.[I usually do what is expected of me and follow instructions carefully.] | |||
| Answer | Count | Percentage | |
| Strongly disagree (J1) | 56 | 1.02% | |
| Disagree (J2) | 537 | 9.81% | |
| Neutral (J3) | 1541 | 28.16% | |
| Agree (J4) | 2824 | 51.61% | |
| Strongly agree (J5) | 417 | 7.62% | |
| No answer | 97 | 1.77% | |
 |
|||
| Field summary for Q13(11) | |||
|---|---|---|---|
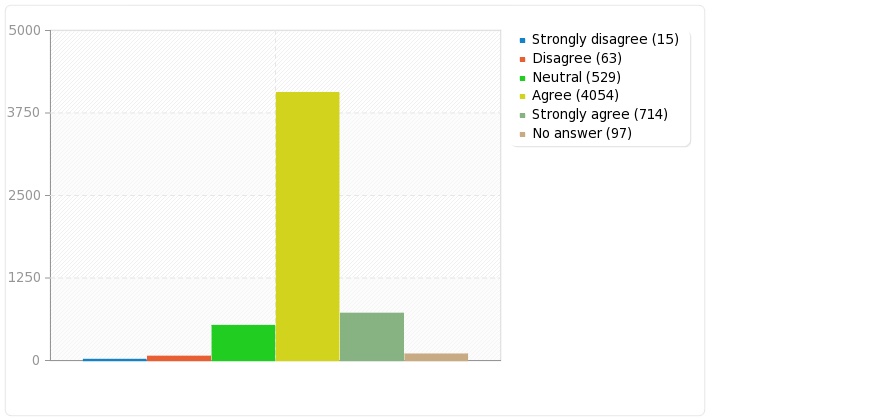
| Please indicate how strongly you agree with the following statements about your most recent job.[I usually understand what colleagues need from me] | |||
| Answer | Count | Percentage | |
| Strongly disagree (J1) | 15 | 0.27% | |
| Disagree (J2) | 63 | 1.15% | |
| Neutral (J3) | 529 | 9.67% | |
| Agree (J4) | 4054 | 74.09% | |
| Strongly agree (J5) | 714 | 13.05% | |
| No answer | 97 | 1.77% | |
 |
|||
| Field summary for Q13(12) | |||
|---|---|---|---|
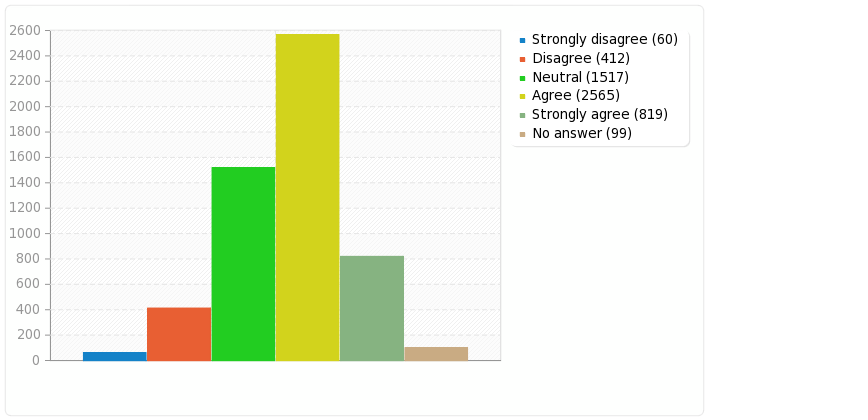
| Please indicate how strongly you agree with the following statements about your most recent job.[I get annoyed if superiors or colleagues take credit for my work.] | |||
| Answer | Count | Percentage | |
| Strongly disagree (J1) | 60 | 1.10% | |
| Disagree (J2) | 412 | 7.53% | |
| Neutral (J3) | 1517 | 27.72% | |
| Agree (J4) | 2565 | 46.88% | |
| Strongly agree (J5) | 819 | 14.97% | |
| No answer | 99 | 1.81% | |
 |
|||
| Field summary for Q13(13) | |||
|---|---|---|---|
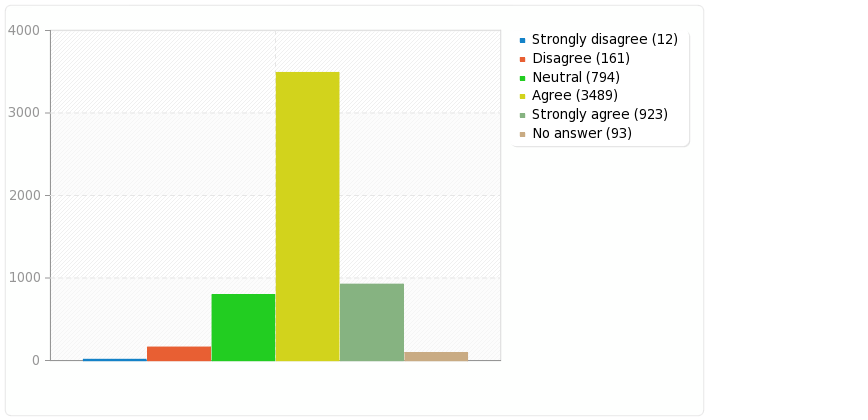
| Please indicate how strongly you agree with the following statements about your most recent job.[I am happy when my colleagues succeed even if I do not.] | |||
| Answer | Count | Percentage | |
| Strongly disagree (J1) | 12 | 0.22% | |
| Disagree (J2) | 161 | 2.94% | |
| Neutral (J3) | 794 | 14.51% | |
| Agree (J4) | 3489 | 63.76% | |
| Strongly agree (J5) | 923 | 16.87% | |
| No answer | 93 | 1.70% | |
 |
|||
| Field summary for Q13(14) | |||
|---|---|---|---|
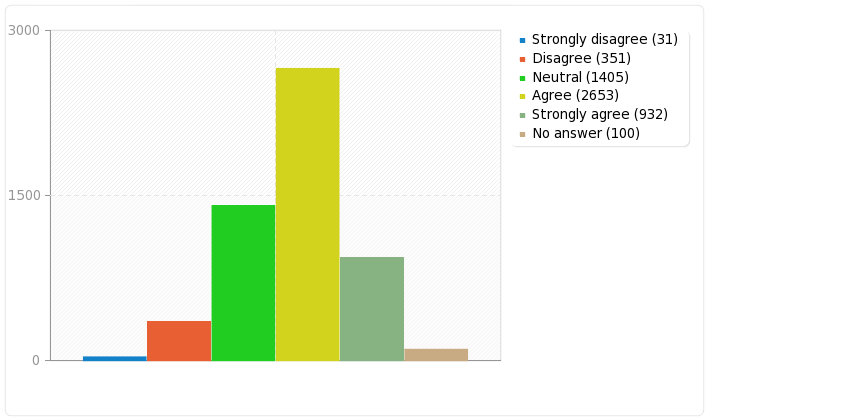
| Please indicate how strongly you agree with the following statements about your most recent job.[I like to test boundaries and get into areas where few have worked before.] | |||
| Answer | Count | Percentage | |
| Strongly disagree (J1) | 31 | 0.57% | |
| Disagree (J2) | 351 | 6.41% | |
| Neutral (J3) | 1405 | 25.68% | |
| Agree (J4) | 2653 | 48.48% | |
| Strongly agree (J5) | 932 | 17.03% | |
| No answer | 100 | 1.83% | |
 |
|||
| Field summary for Q13(15) | |||
|---|---|---|---|
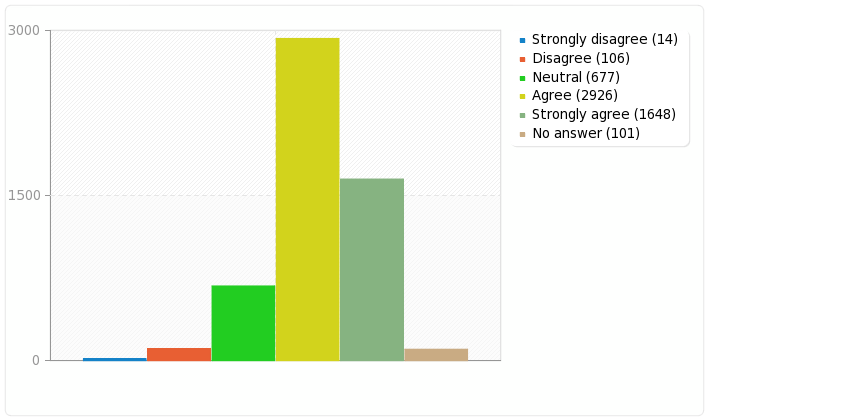
| Please indicate how strongly you agree with the following statements about your most recent job.[I like challenges that stretch my abilities and get bored with things I can do quite easily.] | |||
| Answer | Count | Percentage | |
| Strongly disagree (J1) | 14 | 0.26% | |
| Disagree (J2) | 106 | 1.94% | |
| Neutral (J3) | 677 | 12.37% | |
| Agree (J4) | 2926 | 53.47% | |
| Strongly agree (J5) | 1648 | 30.12% | |
| No answer | 101 | 1.85% | |
 |
|||
| Field summary for Q13(16) | |||
|---|---|---|---|
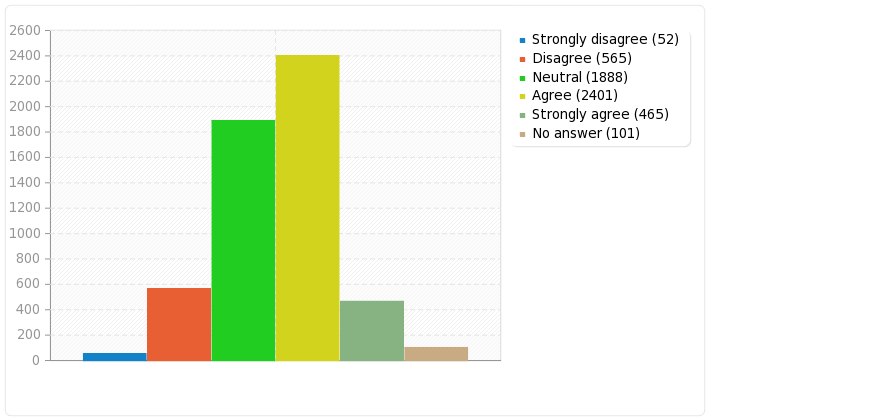
| Please indicate how strongly you agree with the following statements about your most recent job.[I like working where the rules are clear.] | |||
| Answer | Count | Percentage | |
| Strongly disagree (J1) | 52 | 0.95% | |
| Disagree (J2) | 565 | 10.33% | |
| Neutral (J3) | 1888 | 34.50% | |
| Agree (J4) | 2401 | 43.88% | |
| Strongly agree (J5) | 465 | 8.50% | |
| No answer | 101 | 1.85% | |
 |
|||
| Field summary for Q14 | |||
|---|---|---|---|
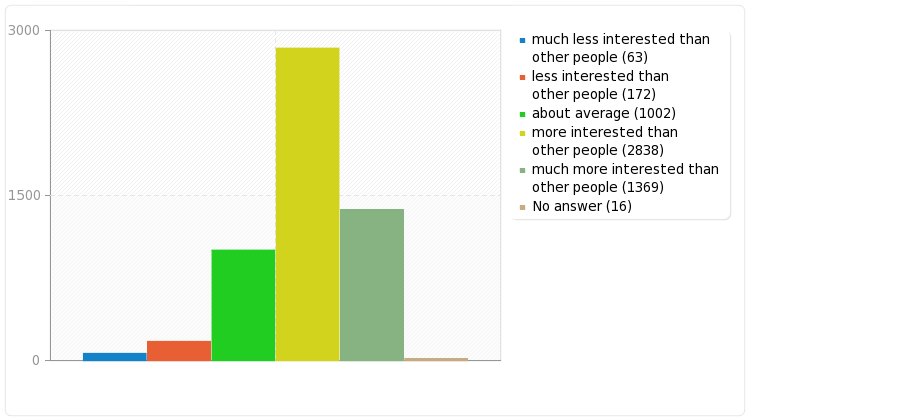
| Excluding the issues of climate & energy, compared to other people, how interested do you think you are you in politics? | |||
| Answer | Count | Percentage | |
| much less interested than other people (1) | 63 | 1.15% | |
| less interested than other people (2) | 172 | 3.15% | |
| about average (3) | 1002 | 18.35% | |
| more interested than other people (4) | 2838 | 51.98% | |
| much more interested than other people (5) | 1369 | 25.07% | |
| No answer | 16 | 0.29% | |
 |
|||
| Field summary for Q15 | |||
|---|---|---|---|
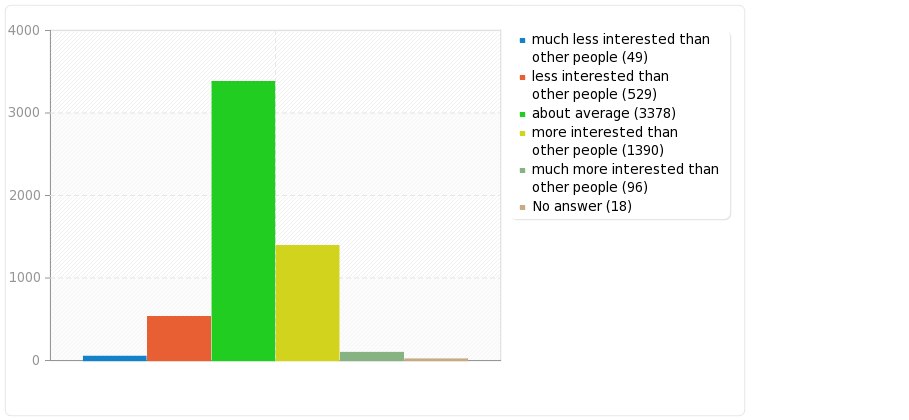
| Excluding the issue of climate & energy, compared to other people, how interested do you think your friends are in politics? | |||
| Answer | Count | Percentage | |
| much less interested than other people (1) | 49 | 0.90% | |
| less interested than other people (2) | 529 | 9.69% | |
| about average (3) | 3378 | 61.87% | |
| more interested than other people (4) | 1390 | 25.46% | |
| much more interested than other people (5) | 96 | 1.76% | |
| No answer | 18 | 0.33% | |
 |
|||
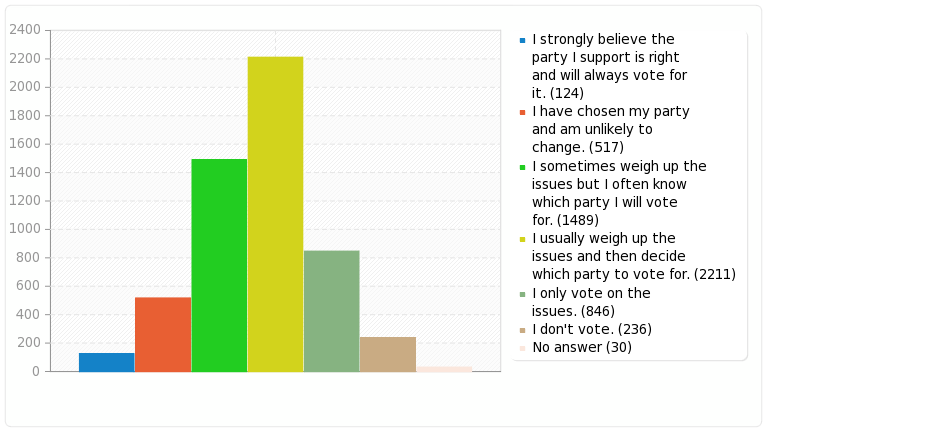
| Field summary for Q17 | |||
|---|---|---|---|
| What best describes your voting pattern | |||
| Answer | Count | Percentage | |
| I strongly believe the party I support is right and will always vote for it. (1) | 124 | 2.27% | |
| I have chosen my party and am unlikely to change. (2) | 517 | 9.48% | |
| I sometimes weigh up the issues but I often know which party I will vote for. (3) | 1489 | 27.31% | |
| I usually weigh up the issues and then decide which party to vote for. (4) | 2211 | 40.55% | |
| I only vote on the issues. (5) | 846 | 15.51% | |
| I don’t vote. (6) | 236 | 4.33% | |
| No answer | 30 | 0.55% | |
 |
|||
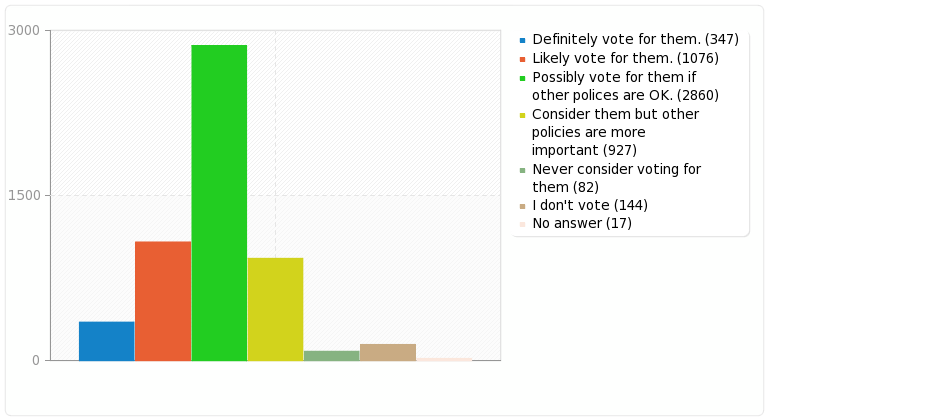
| Field summary for Q18 | |||
|---|---|---|---|
| If a party that you do not normally vote for had a policy on energy or climate which you agreed with, would you: | |||
| Answer | Count | Percentage | |
| Definitely vote for them. (P1) | 347 | 6.36% | |
| Likely vote for them. (P2) | 1076 | 19.73% | |
| Possibly vote for them if other polices are OK. (P3) | 2860 | 52.45% | |
| Consider them but other policies are more important (P4) | 927 | 17.00% | |
| Never consider voting for them (P5) | 82 | 1.50% | |
| I don’t vote (P6) | 144 | 2.64% | |
| No answer | 17 | 0.31% | |
 |
|||
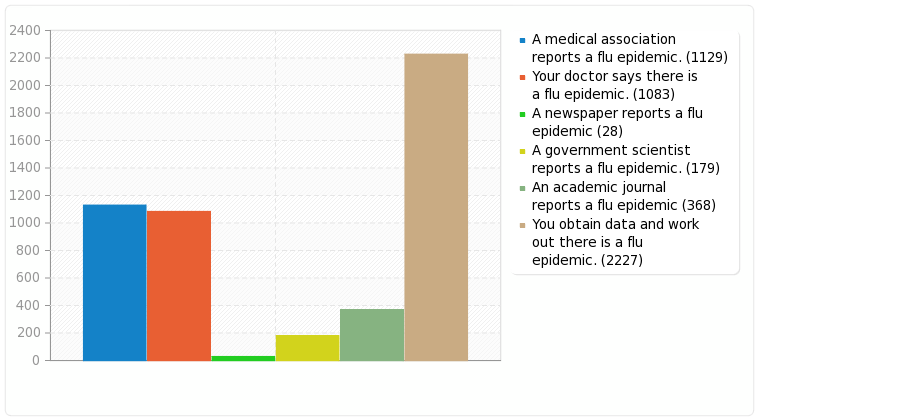
| Field summary for Q21 [1] | |||
|---|---|---|---|
| Drag the items below to rank them, placing highest those that are most trustworthy. Place those you would trust most at the top and those least at the bottom.[Ranking 1] |
|||
| Answer | Count | Percentage | |
| A medical association reports a flu epidemic. (1) | 1129 | 22.52% | |
| Your doctor says there is a flu epidemic. (2) | 1083 | 21.60% | |
| A newspaper reports a flu epidemic (3) | 28 | 0.56% | |
| A government scientist reports a flu epidemic. (4) | 179 | 3.57% | |
| An academic journal reports a flu epidemic (5) | 368 | 7.34% | |
| You obtain data and work out there is a flu epidemic. (6) | 2227 | 44.42% | |
 |
|||
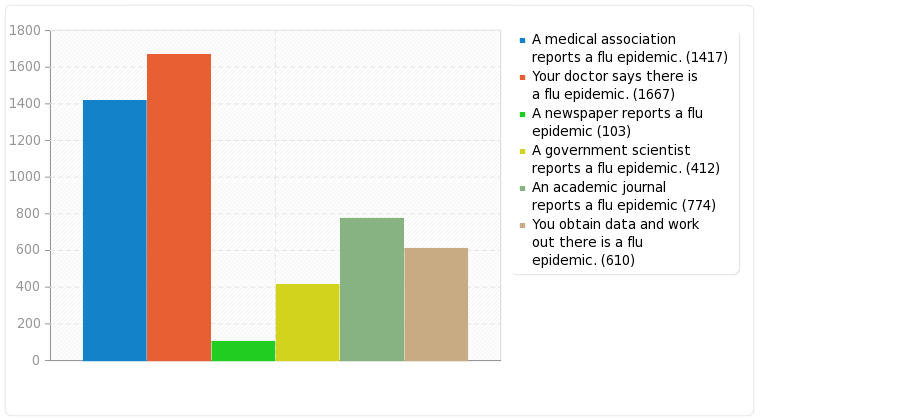
| Field summary for Q21 [2] | |||
|---|---|---|---|
| Drag the items below to rank them, placing highest those that are most trustworthy. Place those you would trust most at the top and those least at the bottom.[Ranking 2] |
|||
| Answer | Count | Percentage | |
| A medical association reports a flu epidemic. (1) | 1417 | 28.44% | |
| Your doctor says there is a flu epidemic. (2) | 1667 | 33.45% | |
| A newspaper reports a flu epidemic (3) | 103 | 2.07% | |
| A government scientist reports a flu epidemic. (4) | 412 | 8.27% | |
| An academic journal reports a flu epidemic (5) | 774 | 15.53% | |
| You obtain data and work out there is a flu epidemic. (6) | 610 | 12.24% | |
 |
|||
| Field summary for Q21 [3] | |||
|---|---|---|---|
| Drag the items below to rank them, placing highest those that are most trustworthy. Place those you would trust most at the top and those least at the bottom.[Ranking 3] |
|||
| Answer | Count | Percentage | |
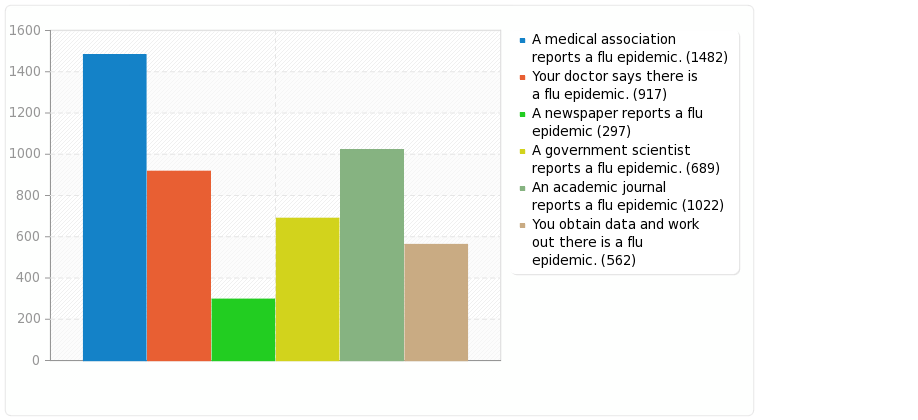
| A medical association reports a flu epidemic. (1) | 1482 | 29.82% | |
| Your doctor says there is a flu epidemic. (2) | 917 | 18.45% | |
| A newspaper reports a flu epidemic (3) | 297 | 5.98% | |
| A government scientist reports a flu epidemic. (4) | 689 | 13.87% | |
| An academic journal reports a flu epidemic (5) | 1022 | 20.57% | |
| You obtain data and work out there is a flu epidemic. (6) | 562 | 11.31% | |
 |
|||
| Field summary for Q21 [4] | |||
|---|---|---|---|
| Drag the items below to rank them, placing highest those that are most trustworthy. Place those you would trust most at the top and those least at the bottom.[Ranking 4] |
|||
| Answer | Count | Percentage | |
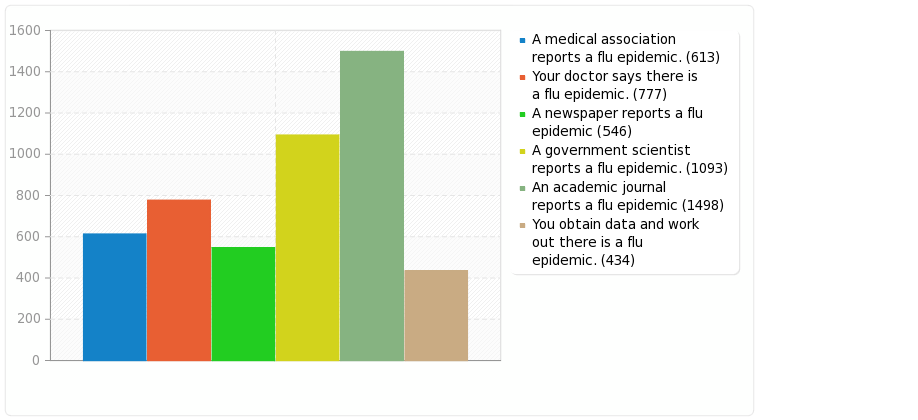
| A medical association reports a flu epidemic. (1) | 613 | 12.36% | |
| Your doctor says there is a flu epidemic. (2) | 777 | 15.66% | |
| A newspaper reports a flu epidemic (3) | 546 | 11.01% | |
| A government scientist reports a flu epidemic. (4) | 1093 | 22.03% | |
| An academic journal reports a flu epidemic (5) | 1498 | 30.20% | |
| You obtain data and work out there is a flu epidemic. (6) | 434 | 8.75% | |
 |
|||
| Field summary for Q21 [5] | |||
|---|---|---|---|
| Drag the items below to rank them, placing highest those that are most trustworthy. Place those you would trust most at the top and those least at the bottom.[Ranking 5] |
|||
| Answer | Count | Percentage | |
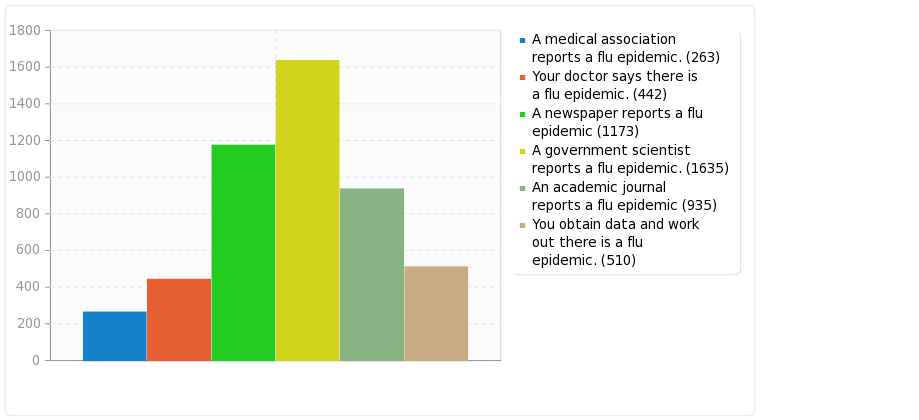
| A medical association reports a flu epidemic. (1) | 263 | 5.30% | |
| Your doctor says there is a flu epidemic. (2) | 442 | 8.91% | |
| A newspaper reports a flu epidemic (3) | 1173 | 23.66% | |
| A government scientist reports a flu epidemic. (4) | 1635 | 32.98% | |
| An academic journal reports a flu epidemic (5) | 935 | 18.86% | |
| You obtain data and work out there is a flu epidemic. (6) | 510 | 10.29% | |
 |
|||
| Field summary for Q21 [6] | |||
|---|---|---|---|
| Drag the items below to rank them, placing highest those that are most trustworthy. Place those you would trust most at the top and those least at the bottom.[Ranking 6] |
|||
| Answer | Count | Percentage | |
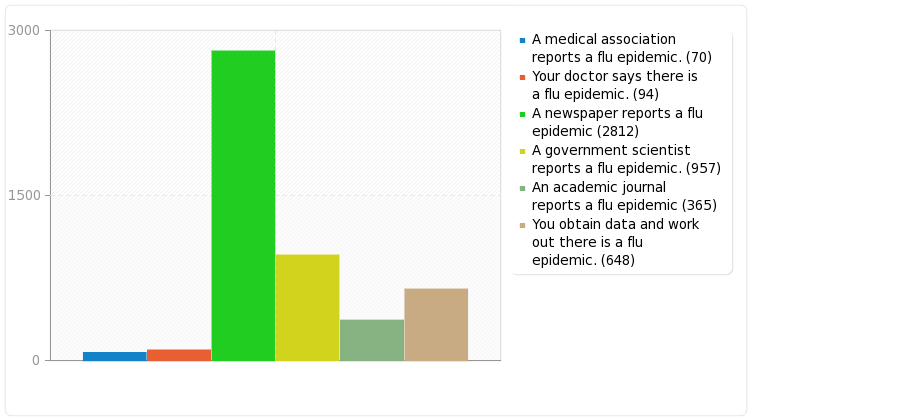
| A medical association reports a flu epidemic. (1) | 70 | 1.42% | |
| Your doctor says there is a flu epidemic. (2) | 94 | 1.90% | |
| A newspaper reports a flu epidemic (3) | 2812 | 56.85% | |
| A government scientist reports a flu epidemic. (4) | 957 | 19.35% | |
| An academic journal reports a flu epidemic (5) | 365 | 7.38% | |
| You obtain data and work out there is a flu epidemic. (6) | 648 | 13.10% | |
 |
|||
| Field summary for Q22 | |||
|---|---|---|---|
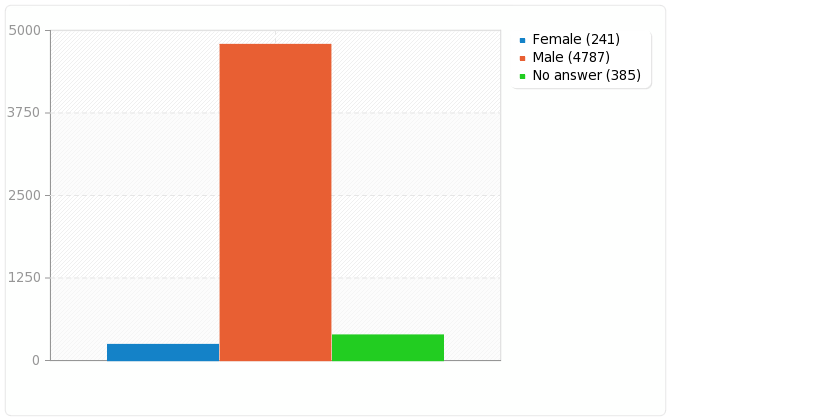
| What is your sex | |||
| Answer | Count | Percentage | |
| Female (F) | 241 | 4.45% | |
| Male (M) | 4787 | 88.44% | |
| No answer | 385 | 7.11% | |
 |
|||
| Field summary for Q23 | |||
|---|---|---|---|
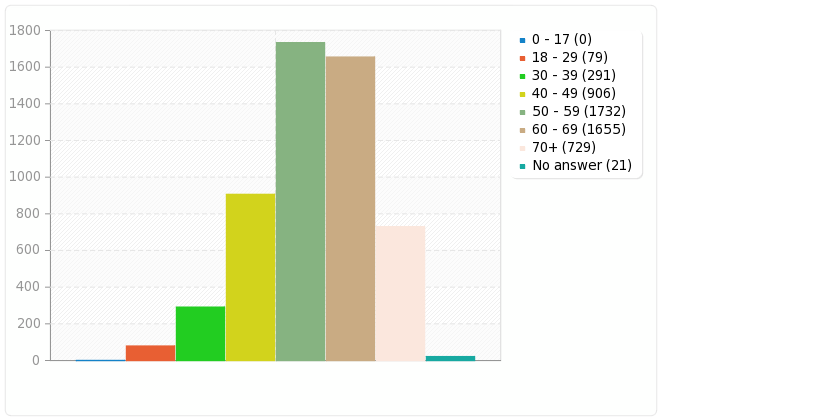
| What is your age? | |||
| Answer | Count | Percentage | |
| 0 – 17 (1) | 0 | 0.00% | |
| 18 – 29 (2) | 79 | 1.46% | |
| 30 – 39 (3) | 291 | 5.38% | |
| 40 – 49 (4) | 906 | 16.74% | |
| 50 – 59 (5) | 1732 | 32.00% | |
| 60 – 69 (6) | 1655 | 30.57% | |
| 70+ (7) | 729 | 13.47% | |
| No answer | 21 | 0.39% | |
 |
|||
| Field summary for Q24 | |||
|---|---|---|---|
| Where was your main childhood home | |||
| Answer | Count | Percentage | |
| United States (220) | 1838 | 34.02% | |
| United Kingdom (219) | 1310 | 24.25% | |
| Afghanistan (1) | 2 | 0.04% | |
| Albania (2) | 1 | 0.02% | |
| Algeria (3) | 1 | 0.02% | |
| American Samoa (4) | 0 | 0.00% | |
| Andorra (5) | 0 | 0.00% | |
| Angola (6) | 0 | 0.00% | |
| Anguilla (7) | 0 | 0.00% | |
| Antarctica (8) | 0 | 0.00% | |
| Antigua and Barbuda (9) | 1 | 0.02% | |
| Argentina (10) | 2 | 0.04% | |
| Armenia (11) | 1 | 0.02% | |
| Aruba (12) | 0 | 0.00% | |
| Australia (13) | 950 | 17.59% | |
| Austria (14) | 15 | 0.28% | |
| Azerbaijan (15) | 0 | 0.00% | |
| Bahamas (16) | 0 | 0.00% | |
| Bahrain (17) | 0 | 0.00% | |
| Bangladesh (18) | 1 | 0.02% | |
| Barbados (19) | 0 | 0.00% | |
| Belarus (20) | 1 | 0.02% | |
| Belgium (21) | 14 | 0.26% | |
| Belize (22) | 0 | 0.00% | |
| Benin (23) | 0 | 0.00% | |
| Bermuda (24) | 0 | 0.00% | |
| Bhutan (25) | 0 | 0.00% | |
| Bolivia (26) | 0 | 0.00% | |
| Bosnia and Herzegovina (27) | 1 | 0.02% | |
| Botswana (28) | 0 | 0.00% | |
| Bouvet Island (29) | 0 | 0.00% | |
| Brazil (30) | 8 | 0.15% | |
| British Indian Ocean Territory (31) | 0 | 0.00% | |
| Brunei Darussalam (32) | 0 | 0.00% | |
| Bulgaria (33) | 2 | 0.04% | |
| Burkina Faso (34) | 0 | 0.00% | |
| Burundi (35) | 0 | 0.00% | |
| Cambodia (36) | 0 | 0.00% | |
| Cameroon (37) | 0 | 0.00% | |
| Canada (38) | 364 | 6.74% | |
| Cape Verde (39) | 0 | 0.00% | |
| Cayman Islands (40) | 0 | 0.00% | |
| Central African Republic (41) | 0 | 0.00% | |
| Chad (42) | 0 | 0.00% | |
| Chile (43) | 3 | 0.06% | |
| China (44) | 0 | 0.00% | |
| Christmas Island (45) | 0 | 0.00% | |
| Cocos Islands (46) | 0 | 0.00% | |
| Colombia (47) | 1 | 0.02% | |
| Comoros (48) | 0 | 0.00% | |
| Congo (49) | 0 | 0.00% | |
| Cook Islands (50) | 0 | 0.00% | |
| Costa Rica (51) | 0 | 0.00% | |
| Cote d’Ivoire (52) | 0 | 0.00% | |
| Croatia (53) | 4 | 0.07% | |
| Cuba (54) | 0 | 0.00% | |
| Cyprus (55) | 1 | 0.02% | |
| Czech Republic (56) | 7 | 0.13% | |
| Denmark (57) | 14 | 0.26% | |
| Djibouti (58) | 0 | 0.00% | |
| Dominica (59) | 0 | 0.00% | |
| Dominican Republic (60) | 0 | 0.00% | |
| Ecuador (61) | 0 | 0.00% | |
| Egypt (62) | 0 | 0.00% | |
| El Salvador (63) | 0 | 0.00% | |
| Equatorial Guinea (64) | 0 | 0.00% | |
| Eritrea (65) | 0 | 0.00% | |
| Estonia (66) | 4 | 0.07% | |
| Ethiopia (67) | 0 | 0.00% | |
| Falkland Islands (68) | 0 | 0.00% | |
| Faroe Islands (69) | 0 | 0.00% | |
| Fiji (70) | 1 | 0.02% | |
| Finland (71) | 32 | 0.59% | |
| France (72) | 20 | 0.37% | |
| French Guiana (73) | 0 | 0.00% | |
| French Polynesia (74) | 0 | 0.00% | |
| Gabon (75) | 0 | 0.00% | |
| Gambia (76) | 0 | 0.00% | |
| Georgia (77) | 0 | 0.00% | |
| Germany (78) | 272 | 5.04% | |
| Ghana (79) | 0 | 0.00% | |
| Gibraltar (80) | 0 | 0.00% | |
| Greece (81) | 0 | 0.00% | |
| Greenland (82) | 0 | 0.00% | |
| Grenada (83) | 0 | 0.00% | |
| Guadeloupe (84) | 0 | 0.00% | |
| Guam (85) | 0 | 0.00% | |
| Guatemala (86) | 1 | 0.02% | |
| Guinea (87) | 0 | 0.00% | |
| Guinea-Bissau (88) | 0 | 0.00% | |
| Guyana (89) | 0 | 0.00% | |
| Haiti (90) | 0 | 0.00% | |
| Heard Island and McDonald Islands (91) | 0 | 0.00% | |
| Honduras (92) | 0 | 0.00% | |
| Hong Kong (93) | 3 | 0.06% | |
| Hungary (94) | 2 | 0.04% | |
| Iceland (95) | 2 | 0.04% | |
| India (96) | 8 | 0.15% | |
| Indonesia (97) | 1 | 0.02% | |
| Iran (98) | 1 | 0.02% | |
| Iraq (99) | 0 | 0.00% | |
| Ireland (100) | 28 | 0.52% | |
| Israel (101) | 5 | 0.09% | |
| Italy (102) | 7 | 0.13% | |
| Jamaica (103) | 0 | 0.00% | |
| Japan (104) | 2 | 0.04% | |
| Jordan (105) | 0 | 0.00% | |
| Kazakhstan (106) | 0 | 0.00% | |
| Kenya (107) | 5 | 0.09% | |
| Kiribati (108) | 0 | 0.00% | |
| Kuwait (109) | 0 | 0.00% | |
| Kyrgyzstan (110) | 0 | 0.00% | |
| Laos (111) | 0 | 0.00% | |
| Latvia (112) | 0 | 0.00% | |
| Lebanon (113) | 0 | 0.00% | |
| Lesotho (114) | 1 | 0.02% | |
| Liberia (115) | 0 | 0.00% | |
| Libya (116) | 0 | 0.00% | |
| Liechtenstein (117) | 0 | 0.00% | |
| Lithuania (118) | 0 | 0.00% | |
| Luxembourg (119) | 4 | 0.07% | |
| Macao (120) | 0 | 0.00% | |
| Madagascar (121) | 0 | 0.00% | |
| Malawi (122) | 1 | 0.02% | |
| Malaysia (123) | 6 | 0.11% | |
| Maldives (124) | 0 | 0.00% | |
| Mali (125) | 0 | 0.00% | |
| Malta (126) | 1 | 0.02% | |
| Marshall Islands (127) | 0 | 0.00% | |
| Martinique (128) | 0 | 0.00% | |
| Mauritania (129) | 1 | 0.02% | |
| Mauritius (130) | 0 | 0.00% | |
| Mayotte (131) | 0 | 0.00% | |
| Mexico (132) | 0 | 0.00% | |
| Micronesia (133) | 0 | 0.00% | |
| Moldova (134) | 0 | 0.00% | |
| Monaco (135) | 0 | 0.00% | |
| Mongolia (136) | 0 | 0.00% | |
| Montenegro (137) | 0 | 0.00% | |
| Montserrat (138) | 0 | 0.00% | |
| Morocco (139) | 1 | 0.02% | |
| Mozambique (140) | 0 | 0.00% | |
| Myanmar (141) | 0 | 0.00% | |
| Namibia (142) | 0 | 0.00% | |
| Nauru (143) | 0 | 0.00% | |
| Nepal (144) | 0 | 0.00% | |
| Netherlands (145) | 55 | 1.02% | |
| Netherlands Antilles (146) | 1 | 0.02% | |
| New Caledonia (147) | 0 | 0.00% | |
| New Zealand (148) | 139 | 2.57% | |
| Nicaragua (149) | 0 | 0.00% | |
| Niger (150) | 1 | 0.02% | |
| Nigeria (151) | 0 | 0.00% | |
| Norfolk Island (152) | 1 | 0.02% | |
| North Korea (153) | 0 | 0.00% | |
| Norway (154) | 32 | 0.59% | |
| Oman (155) | 0 | 0.00% | |
| Pakistan (156) | 0 | 0.00% | |
| Palau (157) | 0 | 0.00% | |
| Palestinian Territory (158) | 0 | 0.00% | |
| Panama (159) | 0 | 0.00% | |
| Papua New Guinea (160) | 4 | 0.07% | |
| Paraguay (161) | 1 | 0.02% | |
| Peru (162) | 1 | 0.02% | |
| Philippines (163) | 2 | 0.04% | |
| Pitcairn (164) | 0 | 0.00% | |
| Poland (165) | 14 | 0.26% | |
| Portugal (166) | 8 | 0.15% | |
| Puerto Rico (167) | 1 | 0.02% | |
| Qatar (168) | 0 | 0.00% | |
| Romania (169) | 5 | 0.09% | |
| Russian Federation (170) | 5 | 0.09% | |
| Rwanda (171) | 0 | 0.00% | |
| Saint Helena (172) | 0 | 0.00% | |
| Saint Kitts and Nevis (173) | 0 | 0.00% | |
| Saint Lucia (174) | 0 | 0.00% | |
| Saint Pierre and Miquelon (175) | 0 | 0.00% | |
| Saint Vincent and the Grenadines (176) | 0 | 0.00% | |
| Samoa (177) | 0 | 0.00% | |
| San Marino (178) | 0 | 0.00% | |
| Sao Tome and Principe (179) | 0 | 0.00% | |
| Saudi Arabia (180) | 1 | 0.02% | |
| Senegal (181) | 0 | 0.00% | |
| Serbia (182) | 1 | 0.02% | |
| Seychelles (183) | 0 | 0.00% | |
| Sierra Leone (184) | 0 | 0.00% | |
| Singapore (185) | 3 | 0.06% | |
| Slovakia (186) | 0 | 0.00% | |
| Slovenia (187) | 4 | 0.07% | |
| Solomon Islands (188) | 0 | 0.00% | |
| Somalia (189) | 0 | 0.00% | |
| South Africa (190) | 40 | 0.74% | |
| South Georgia (191) | 0 | 0.00% | |
| South Korea (192) | 1 | 0.02% | |
| Spain (193) | 8 | 0.15% | |
| Sri Lanka (194) | 0 | 0.00% | |
| Sudan (195) | 0 | 0.00% | |
| Suriname (196) | 0 | 0.00% | |
| Svalbard and Jan Mayen (197) | 0 | 0.00% | |
| Swaziland (198) | 1 | 0.02% | |
| Sweden (199) | 58 | 1.07% | |
| Switzerland (200) | 18 | 0.33% | |
| Syrian Arab Republic (201) | 1 | 0.02% | |
| Taiwan (202) | 0 | 0.00% | |
| Tajikistan (203) | 0 | 0.00% | |
| Tanzania (204) | 1 | 0.02% | |
| Thailand (205) | 0 | 0.00% | |
| The Former Yugoslav Republic of Macedonia (206) | 0 | 0.00% | |
| Timor-Leste (207) | 0 | 0.00% | |
| Togo (208) | 0 | 0.00% | |
| Tokelau (209) | 0 | 0.00% | |
| Tonga (210) | 0 | 0.00% | |
| Trinidad and Tobago (211) | 1 | 0.02% | |
| Tunisia (212) | 0 | 0.00% | |
| Turkey (213) | 1 | 0.02% | |
| Turkmenistan (214) | 0 | 0.00% | |
| Tuvalu (215) | 0 | 0.00% | |
| Uganda (216) | 0 | 0.00% | |
| Ukraine (217) | 1 | 0.02% | |
| United Arab Emirates (218) | 0 | 0.00% | |
| Uruguay (222) | 1 | 0.02% | |
| Uzbekistan (223) | 1 | 0.02% | |
| Vanuatu (224) | 0 | 0.00% | |
| Vatican City (225) | 1 | 0.02% | |
| Venezuela (226) | 1 | 0.02% | |
| Vietnam (227) | 0 | 0.00% | |
| Virgin Islands (228) | 0 | 0.00% | |
| Wallis and Futuna (229) | 0 | 0.00% | |
| Western Sahara (230) | 0 | 0.00% | |
| Yemen (231) | 0 | 0.00% | |
| Zambia (232) | 1 | 0.02% | |
| Zimbabwe (233) | 14 | 0.26% | |
| No answer | 22 | 0.41% | |
 |
|||
| Field summary for state | |||
|---|---|---|---|
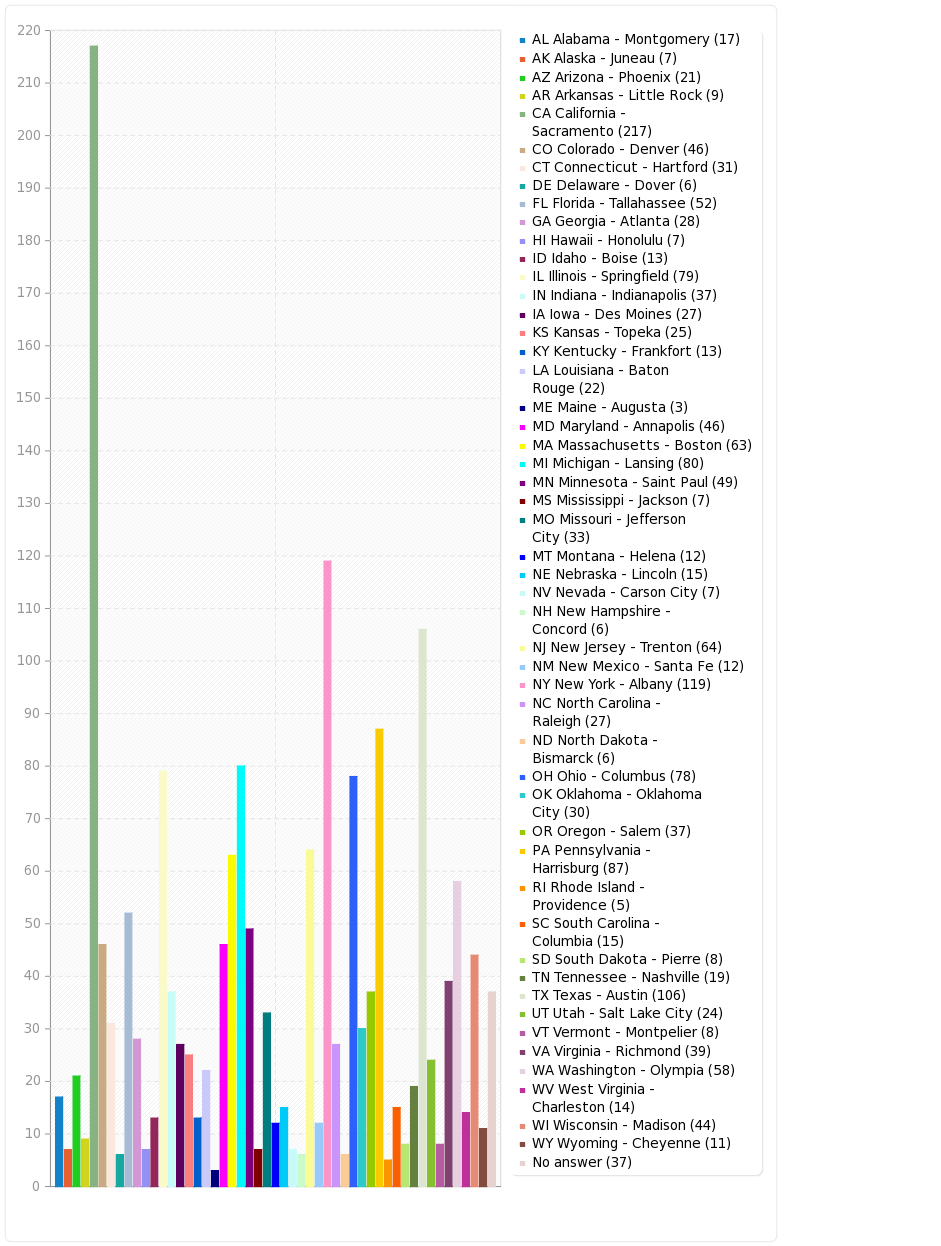
| For the US please also give the state | |||
| Answer | Count | Percentage | |
| AL Alabama – Montgomery (1) | 17 | 0.93% | |
| AK Alaska – Juneau (2) | 7 | 0.38% | |
| AZ Arizona – Phoenix (3) | 21 | 1.15% | |
| AR Arkansas – Little Rock (4) | 9 | 0.49% | |
| CA California – Sacramento (5) | 217 | 11.88% | |
| CO Colorado – Denver (6) | 46 | 2.52% | |
| CT Connecticut – Hartford (7) | 31 | 1.70% | |
| DE Delaware – Dover (8) | 6 | 0.33% | |
| FL Florida – Tallahassee (9) | 52 | 2.85% | |
| GA Georgia – Atlanta (10) | 28 | 1.53% | |
| HI Hawaii – Honolulu (11) | 7 | 0.38% | |
| ID Idaho – Boise (12) | 13 | 0.71% | |
| IL Illinois – Springfield (13) | 79 | 4.33% | |
| IN Indiana – Indianapolis (14) | 37 | 2.03% | |
| IA Iowa – Des Moines (15) | 27 | 1.48% | |
| KS Kansas – Topeka (16) | 25 | 1.37% | |
| KY Kentucky – Frankfort (17) | 13 | 0.71% | |
| LA Louisiana – Baton Rouge (18) | 22 | 1.20% | |
| ME Maine – Augusta (19) | 3 | 0.16% | |
| MD Maryland – Annapolis (20) | 46 | 2.52% | |
| MA Massachusetts – Boston (21) | 63 | 3.45% | |
| MI Michigan – Lansing (22) | 80 | 4.38% | |
| MN Minnesota – Saint Paul (23) | 49 | 2.68% | |
| MS Mississippi – Jackson (24) | 7 | 0.38% | |
| MO Missouri – Jefferson City (25) | 33 | 1.81% | |
| MT Montana – Helena (26) | 12 | 0.66% | |
| NE Nebraska – Lincoln (27) | 15 | 0.82% | |
| NV Nevada – Carson City (28) | 7 | 0.38% | |
| NH New Hampshire – Concord (29) | 6 | 0.33% | |
| NJ New Jersey – Trenton (30) | 64 | 3.50% | |
| NM New Mexico – Santa Fe (31) | 12 | 0.66% | |
| NY New York – Albany (32) | 119 | 6.52% | |
| NC North Carolina – Raleigh (33) | 27 | 1.48% | |
| ND North Dakota – Bismarck (34) | 6 | 0.33% | |
| OH Ohio – Columbus (35) | 78 | 4.27% | |
| OK Oklahoma – Oklahoma City (36) | 30 | 1.64% | |
| OR Oregon – Salem (37) | 37 | 2.03% | |
| PA Pennsylvania – Harrisburg (38) | 87 | 4.76% | |
| RI Rhode Island – Providence (39) | 5 | 0.27% | |
| SC South Carolina – Columbia (40) | 15 | 0.82% | |
| SD South Dakota – Pierre (41) | 8 | 0.44% | |
| TN Tennessee – Nashville (42) | 19 | 1.04% | |
| TX Texas – Austin (43) | 106 | 5.81% | |
| UT Utah – Salt Lake City (44) | 24 | 1.31% | |
| VT Vermont – Montpelier (45) | 8 | 0.44% | |
| VA Virginia – Richmond (46) | 39 | 2.14% | |
| WA Washington – Olympia (47) | 58 | 3.18% | |
| WV West Virginia – Charleston (48) | 14 | 0.77% | |
| WI Wisconsin – Madison (49) | 44 | 2.41% | |
| WY Wyoming – Cheyenne (50) | 11 | 0.60% | |
| No answer | 37 | 2.03% | |
 |
|||
| Field summary for Q25 | |||
|---|---|---|---|
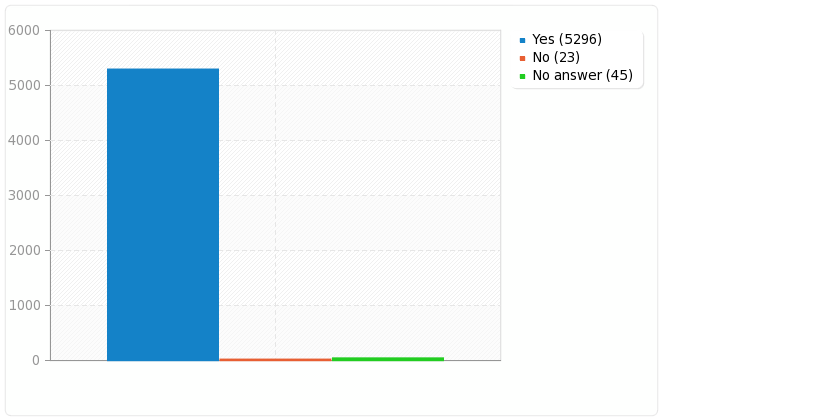
| Do the answers you gave in this survey honestly reflect your views? | |||
| Answer | Count | Percentage | |
| Yes (Y) | 5296 | 98.73% | |
| No (N) | 23 | 0.43% | |
| No answer | 45 | 0.84% | |
 |
|||
| Field summary for Q26 | |||
|---|---|---|---|
| To help detect fake entries, please type something random in the box below: | |||
| Count | Percentage | ||
| Answer | 5320 | 99.18% | |
| No answer | 44 | 0.82% | |
| Field summary for Q28 | |||
|---|---|---|---|
| Finally, if you have any other comments please add them below. | |||
| Count | Percentage | ||
| Answer | 1884 | 35.12% | |
| No answer | 3480 | 64.88% | |


“So we approached both the UK and Scottish government for help to complete the analysis of the survey and publish the results. Despite regularly making false statements about us sceptics, neither government were interested in the facts.”
This says everything we need to know about what is going on.
In another online survey by the UN , once again the public has spoken out on what it finds important, action on climate change comes last.
http://data.myworld2015.org/
I wrote a very professional letter explaining the survey and asking for help securing funding. And they replied that there was no funding, they were not prepared to make any available and they were clearly not even willing to help us find any other source.
In short: “go away”
Will you give a link to the raw data? No promises, but I feel like I’d like to mess around with it a bit.
Unfortunately, the questionnaire allowed any textual responses. Many people have added details that are so specific that you could identify individuals. This not only makes classification very difficult (one reason I wanted advice) but it can also reveal individuals. For example, using a bogus example, how many Ostrich farms are there in Texas?
And if you read the last article I published today, “how to convince a sceptic”, you will see that I know of all groups of people, the one group who will be most unhappy that I do not publish the raw data are the participants of this survey.
That does not mean I may not at some point release a subset. But with 5000 respondents even a 0.01% chance of identifying someone is way too high.
After your comments I had another look. First, I managed to load it to open office, so whatever the problem was last year it seems to have gone. So, I was able to view the data directly. I have removed geographical information, any unique information to an entry and any text entered to a field “other”. I’ve also removed anyone who did not say “I entered this data honestly”.
It is now on the post: http://scottishsceptic.co.uk/2015/02/16/how-to-convince-a-skeptic-just-give-them-the-data/
Thanks. Got it. And entered password successfully.
Pingback: Predictors of climate alarmism and scepticism | Scottish Sceptic
Pingback: It’s easy to convince an alarmist – ad hominen attacks! | Scottish Sceptic
Pingback: A personal apology to Obama and Cameron | Scottish Sceptic
Pingback: A sceptic’s view of climate | Scottish Sceptic
Pingback: The Academic Ape: Instinctive aggression and boundary enforcing behaviour in academia | Scottish Sceptic