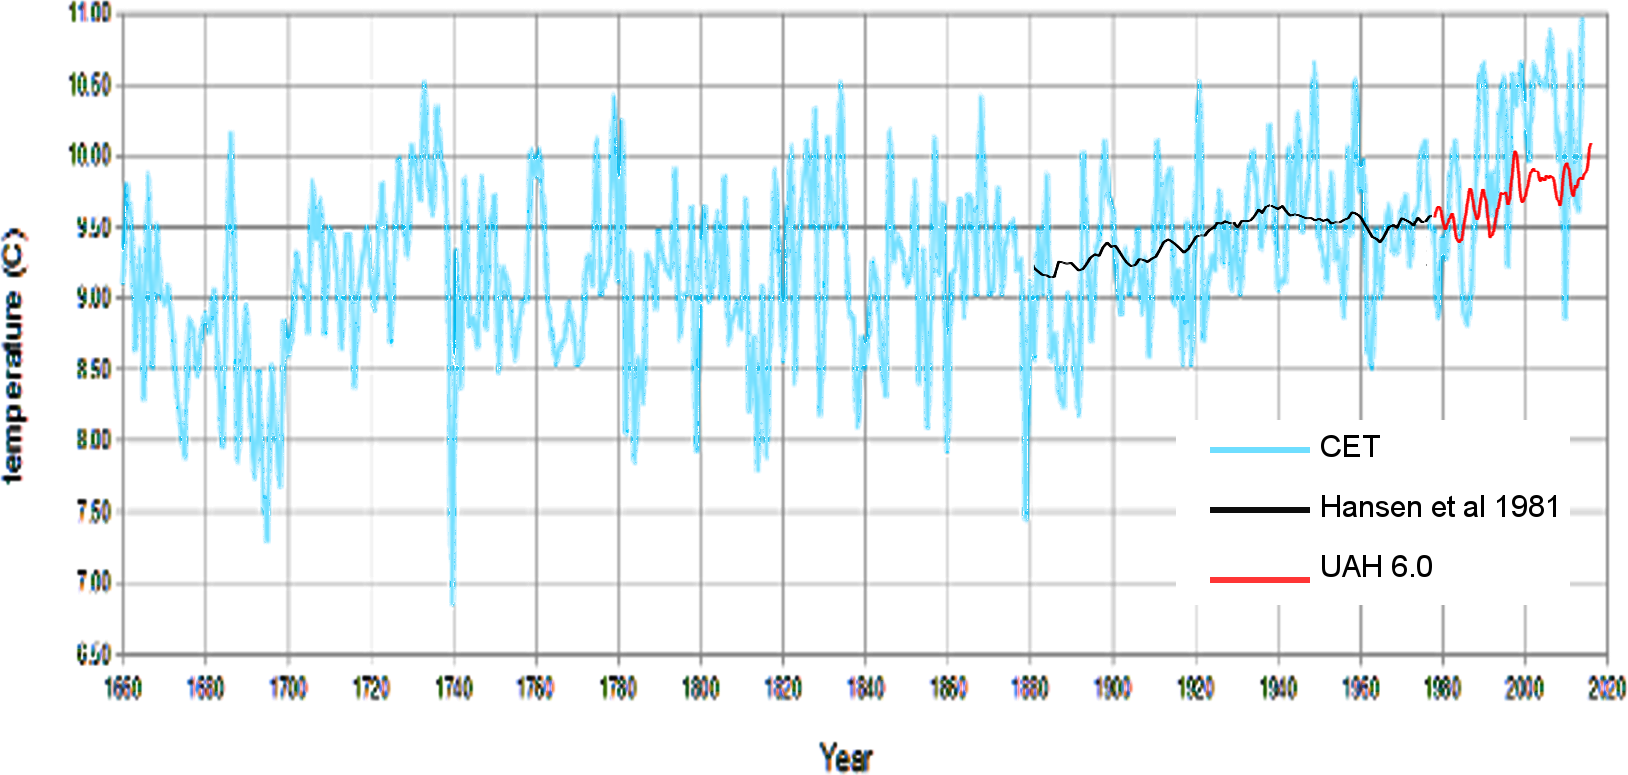
Recently there’s been a couple of times I needed a global temperature but for obvious reasons I do not think it would be ethical to use reconstructions that I feel are fraudulent. This has left only UAH6 (which is the best impartial temperature we have in terms of the modern era from ~1980. Before that we now have a host of literally fabricated graphs that consistently add warming.
However, back in 1981, the guys at NASA were still in two minds about whether the world was warming or cooling. As such, whilst the data may have inherent biases like urban heating, it doesn’t necessarily have cherry picking of stations and processing techniques to manufacture an additional trend.
So, I started with a copy of Hansen et al 1981. Allegedly this is a 5 year running mean, but when I tried to match it to a similar running mean of UAH there was clearly far more variation in UAH. So, eventually I used a 20year smoothing on UAH 6.0
However, unfortunately, UAH starts in 1980 and Hansen et al finishes then, so they do not overlap. So in order to judge the the vertical offset I grabbed a copy of the Central England Temperature series. I’m not sure of the smoothing on this.
Hansen et al 1981 fits reasonable well – showing that CET is a good proxy for global temperature, but then the UAH 6.0 section shows a good start and then England is about 1C warmer between 1990 and 2009. I’ve checked several times and I can’t see anything wrong with the scaling so it appears to be genuine. It still needs work, but I’ll post it anyway in case anyone spots any obvious mistakes or has any ideas about vertical alignment.
Comment
Is it just me or does that “catastrophic global warming” scam look pretty daft when you see it shown thus. In particular – I’m struggling to reconcile is the feeling that there ought to be more warming in the last section … whilst knowing that on CET even the higher warming shown is totally unremarkable. So global temperature change shown red+black is less remarkable than not remarkable.
What’s all the fuss about?


Hello, SS,
Your observation regarding the slight misalignment of CET with UAH interests me. I believe myself to be reasonably expert in the CET department, having studied it in detail since the early 1990s. I could send you countless plots of various types all relating to CET, but the most apposite one (which I can’t send except via email) is a cusum plot for CET monthly anomalies (I call them differences because they are not anomalies, simply observational facts). This type of plot reveals instantly that something happened to N W Europe mean monthly temperatures towards the end of 1987. This event, for which I offer no explanation or even a guess as to what happened, resulted in a temperature step change of around 0.7 deg C – varying a bit, but remarkably consistent over places from western France to eastern Europe, including Ireland and the UK. It is seen in the far east (Vladivostok) but occurs there some months later.
I have never seen any reports of this event, except possibly for The Netherlands, where I seem to remember it being remarked upon – but I have no reference.
A related observation is that if you perform linear fits of individual site mean monthly data, starting in about September 1987 the slope of the data (trend?) is close to zero. The Pause seems to me to have started in 1987.
All this is much more readily seen if you de-seasonalise the data, by subtracting the overall monthly mean for a given month from the individual observations, as noted above. Including the gross seasonal changes simply reduces the value of any regression analysis unless you add eleven dummy variables to describe the month of the observations. The outcome is the same but the computations are much lengthier.
Anyway, if you are interested in all this please let me have an email contact so that I can send diagrams.
Cheers,
Robin (Bromsgrove)