This is a write up of a presentation I gave which Neil Craig has been badgering me to put on line. It was written for a Scottish audience, but the argument and conclusion are valid worldwide.
An Energy Policy to Get Out Of Recession
In this talk I will outline an argument that a good energy policy is not only critical to get us out of recession but that energy is so intrinsically linked to GDP that energy policy more or less dictates how our economy performs.
Energy
So what is energy? The idea is not difficult for as my five year old son said:
“ENERGY IS THE POWER TO MAKE US DO THINGS”
Scientifically, the idea of energy started when people like Coriolis introduced the idea of energy being the work done. Work is something we do such as lifting a weight up or the work done when e.g. the dropping weight of a clock turns the dial. Another example is the work done as water falls down a water mill and drives machinery.
With the development of steam power, people began to realise that burning things to produce heat was also a way of creating energy or replacing the work done by a human or animal turning a wheel. At first people like the Luddites thought that all this “cheap labour” produced by burning wood or fossil fuels like coal was a “bad thing” because in effect coal was a cheap labourer replacing the more costly “food powered labourer”.
That did not happen.
Replacing human labourers, by machinery did not end the need for human labour. In the industrial age, mankind’s labour was needed in addition to machinery. We had human machines whose energy derived from food. And mechanised machines producing work, first from water & wind, and then the cheaper coal and eventually gas and oil.
Both machines and humans “work”.
GDP
GDP or gross domestic product can be measured or more accurately estimated, by a number of techniques. For our purposes the best measure to illustrate the point is that:
GDP is total (inflation adjusted) earnings from work (+ a few other things)
Rising GDP is an indication of a prosperous economy. In other words when GDP is rising even allowing for inflation, we are all earning more and more or to turn it around, we are all spending more and more.
But what does this really mean? The key to understanding GDP, is to understand how inflation is calculated. This is done by calculating the cost of a “basket of goods” which is thought to represent the cost of goods purchased by the typical household. If the cost of this basket increases, the price goes up and this increase is inflation (it seldom comes down). So we measure inflation by the monetary change of a standard basket of goods.
So, another way to describe rising GDP is that the average person can purchase a bigger and bigger basket of typical goods.
GDP & Energy
Both energy and GDP are related to work. GDP is the goods the average person can purchase on an average income. Energy is the work done by a unit of energy … which at one time was the average work by a person. GDP is earnings from the work done by the average person.
Why Energy increases Prosperity
A long time ago, the work done in the economy was entirely human. That work was powered by food. An average day’s work needed an average day’s food. The worker needed the energy from their food and the energy per adult male consumes about 2-3000 calories per day (~10,000kj or ~10megajoule) which is about the same energy as comes from 300ml** of petrol.
But about a million years ago, man stumbled across fire. As a result, the energy available to us increased because now we could keep warm not just from what we ate but also from burning. So this added energy usage improved our standard of living and improved our comfort.
Some thousands of years ago, our energy usage increased still further when we domesticated animals. Animals could labour in our place or in some societies slavery increased the work done per “citizen”. Those labourers had to be fed. That food was like petrol in our cars and our energy demand increased alongside increased prosperity.
So, even before money, energy was adding to prosperity in the same way as now but without money. We had an economy based not on money but on work and energy. The unit of exchange wasn’t money but energy mostly in food. I call this an: “Enerconomy”.
GDP is energy
But the enerconomy is more than something like the economy. As the graph below shows (fig 1) world GDP and world energy show a high degree of correlation.
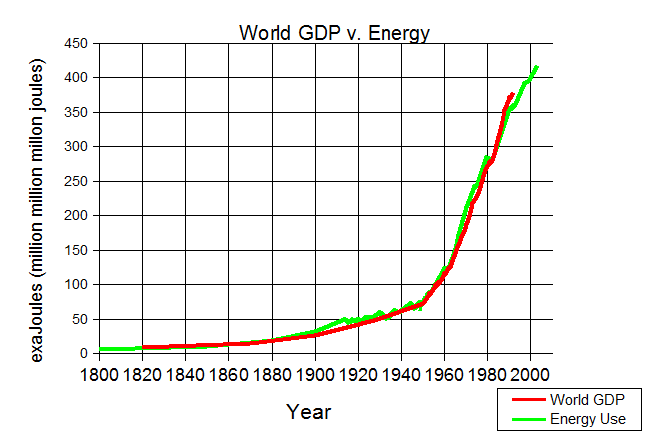 Fig 1: World Energy. (in exajoules) versus world GDP (scaled to fit)
Energy use includes figure for wood burning.
The red line for world GDP closely follows the line for energy usage in green. (You might like to compare this to the global warming curve & CO2 fit shown at the end of this article) The graph above shows that over a very long time world GDP and energy usage have risen at the same rate.
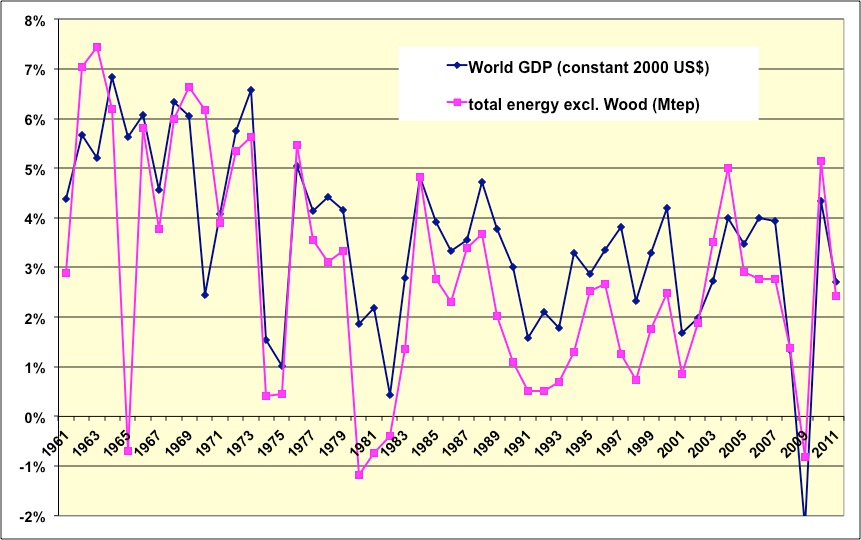
Fig 2: Change in world GDP against change in energy usage
But as the graph above shows (fig 2), when we look at the detail of year to year changes in GDP, we see these are matched by changes in world energy usage. As world GDP (blue) rises and falls, total world energy use (pink) also rises and falls in sync. This strongly suggests the two are closely related.
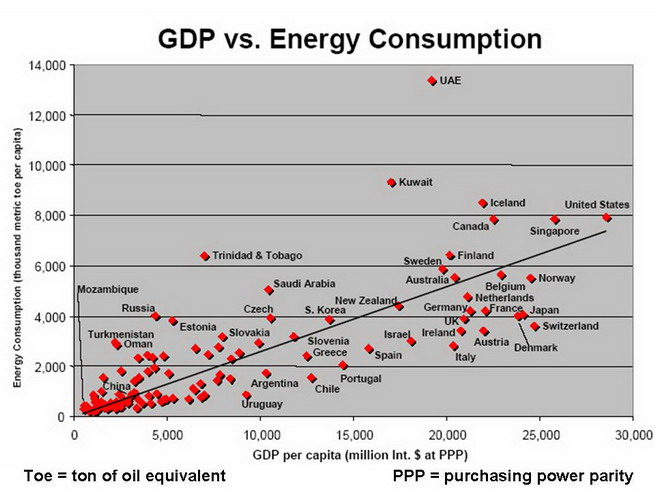 Fig 3: GDP per country versus energy usage
And when we look at each region we see the same pattern. Looking at fig 3 above we see that GDP per capita rises the more energy each country uses.This shows that:
for all reasonable purposes Energy is a proxy for world GDP.
In other words if GDP rises, energy rises, or if energy usage rises then we should expect GDP to rise.
 Fig 4: Changing energy use and GDP for selected countries
And yet again we see in fig 4 above that there is a natural increase in energy use as countries increase GDP. But why shouldn’t the relationship be the other way around? Could rising energy availability lead to rising GDP? In the same way that having more wood gave humans a better living standard 1milion years ago and domesticated animals and windmills all made our lives more comfortable, doesn’t coal, electricity and petrol do the same for us today?
 Fig 5: Cost of materials against energy in production
And as fig 5 above shows, there is a very close relationship between the energy used in producing materials and the cost of the raw material. These raw materials are combined with others, in manufacturing processes using energy, in transport that uses energy, in vehicles produced from raw materials whose cost is directly related to energy – and all that energy adds to the cost of what we buy so that as the total energy used in producing, distributing and selling items increases so does its cost. This seems to suggest that:
Energy use does not increase as a result of rising GDP,
but rising GDP and rising energy use are the same thing!
The problem with Green economics – destroy the economy to “Save the planet”
It has been long known that we cannot have GDP growth without growing the availability of energy. Usually, the argument is: we must reduce economic activity to “save the planet”.
But what happens when we try to reduce energy usage? In recent years, countries across the globe have been trying to reduce CO2 emissions by cutting their energy consumption and by switching their energy production. Looking at energy use of the the USA, China, India and the EU from 1980, only the EU has seen a drop in in CO2 from energy usage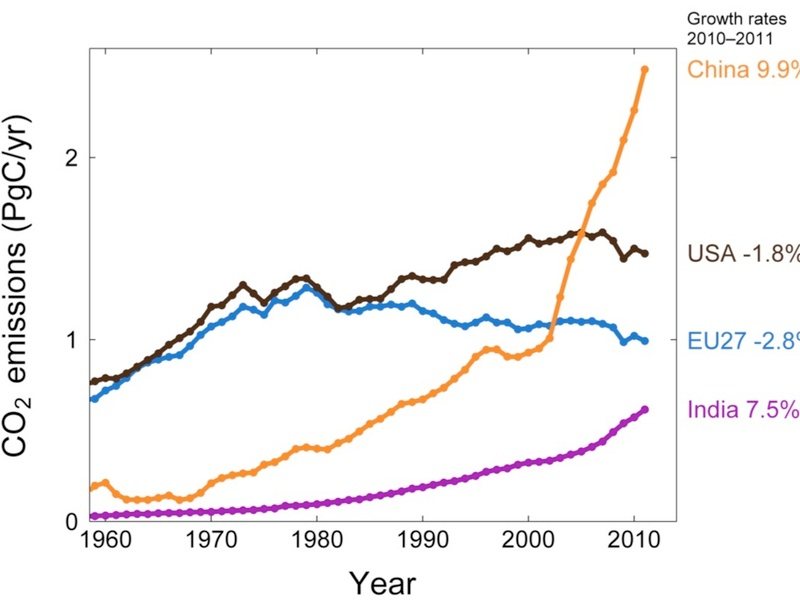
Fig 6: Energy Usage of USA (brown) EU (blue) China(Orange) India (purple)
And what has been the effect on GDP?
EU energy and GDP have gone down.
Is this another example of the link between energy usage and GDP? It seems so from the way fig 6 (above) shows a drop in EU energy usage and fig 7 (below) shows a similar drop in EU GDP . The polices that try to reduce energy appear to either go hand in hand with reducing GDP, or reducing energy is CAUSING reducing GDP.
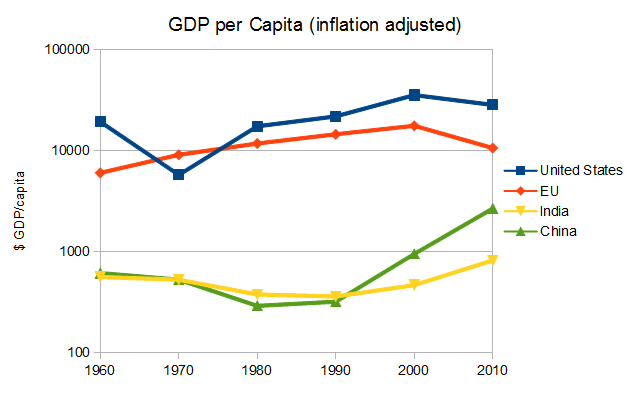 Fig 7: GDP (inflation adjusted) for USA (blue) & EU (orange Kyoto signatory) and India (yellow) & China (yellow) which were not obliged to cut CO2 under Kyoto
The problem with green economics – Energy saving schemes don’t work
The reason for this is obvious when we understand that energy and money are two sides of the same measure. Unless we understand that energy usage cannot be reduced without reducing GDP we don’t understand why schemes for “energy efficiency” will not reduce energy usage overall. This is because in practical terms, all “energy efficiency” does is to reduce our energy usage and save us. Do, e.g. insulating our homes does, reduces our energy bills and appears to reduce energy usage, but it also saves us money. Then what do we do with this extra money? We spend it …. on goods which require huge amounts of energy to produce, transport, heating for shops, etc., so that when we take it all into account, the increase in energy from that extra spending power matches the energy we thought we had saved. So … just the same amount of energy is used … just in a different place.
The reality of energy and economics – money is stored energy
Rising GDP means we can all afford to buy a bigger and bigger basket of the typical goods. Those goods take energy to produce. For food, that energy is largely natural. For manufactured goods, most of that energy is from fossil fuels. The energy used to produce goods – the “stored energy value” of e.g. a “Mars bar” or an apple, or even a simple steel knife, set by energy costs in manufacture. Whilst energy use may vary between manufacturers, in a free market, all other things being equal we choose the lowest cost goods. The cost of goods is largely determined by the energy use. In a free market therefore we choose the goods using the lowest energy to produce.
From this I think we can draw three conclusions:
- In a free market, the cost of any good largely reflects the energy used in producing that good.
Therefore because free markets encourage the lowest priced goods:
- In a free market, the energy used in producing any good is minimised.
The cost of energy, whether food like wheat, oil, coal or wind is mainly determined, by the goods used in producing the means to harvest the energy (like the windmill) and the process of harvesting it. And as the price of those goods (like steel for windmills) is largely determined by the energy used in their production it is almost certainly true that:
- If any energy source (per unit delivered) costs significantly more than the average market price for energy, then that added cost shows us how much extra energy is being used in delivering that energy source.
So when governments subsidise generation of energy, such as wind, wave and tidal so that the producer gets far more than the actual price of energy, as determined by the free market for energy, what this added cost represents is a higher energy usage in producing that energy source than economic energy sources.
We often hear the assertion that “wind is free”. This is either complete nonsense or just a statement that coal, gas, water, gold … are all “free”, in the natural state. What costs is harvesting them. The costs of harvesting subsided energy generation like wind is higher because far more energy is used to build the machinery and run the transmission lines, which all adds to the cost of the “free” energy in its natural state.
And for these subsidised technologies, like wind, it is quite likely the energy delivered is significantly less than the total energy consumed in harvesting and delivering that energy. That would mean they use more energy than they produce!
Rather than a free market being wasteful … free markets are the best way to ensure maximum energy efficiency. Distortions to the market tend to reduce both energy and economic efficiency. They may be tolerated in the short term if there is perceived to be a longer term gain from market intervention (usually by government).
But what are the EU doing? They are not reducing energy usage by energy efficiency, because any money saved is just spent on other things which use as much energy, and they are not saving energy, because they are forcing people to take energy from the less efficient and therefore higher cost energy sources. Instead, they are cutting energy use as the economy of Europe collapses because European industry can no longer compete with countries where energy prices are not artificially raised by senseless “green” policies.
The problem with green economics – CO2 is not a problem
Global temperature has not risen in last 15+ years. Severe weather has not increased. CO2 is an essential plant food which increases agricultural output. Moderate warming as we expect from the greenhouse effect of the small increase in CO2 is overwhelmingly beneficial … as anyone with a greenhouse will know! … particularly in Scotland.
How to revitalise the Scottish Economy:
- Stop politicians interfering with the cost of energy. Even if CO2 were a problem, because wind is so expensive, it is almost certain that more CO2 is produced as a result of this policy than without it.
- Stop wasting our money on wasteful wind.
- Stop trying to reduce energy usage
- Encourage fracking
- Encourage nuclear fusion.
END
Appendix: good and bad correlation
The relationship between CO2 and global temperature is an excellent example of two measures that are said to have good correlation. This is because as shown in fig 8, like world GDP and energy, the CO2 and temperature, when scaled up appear to follow each other.
We have all heard it said that some people are “certain” man-made CO2 caused the 20th century temperature rise. So how does this compare with the correlation between world energy and GDP? As the graph below shows, the relationship between energy and GDP is far far better. The GDP-Energy graph is a close fit. The temperature-CO2 graph (as shown) is a poor fit and e.g. there are massive problems with the 1940s peak that cannot be explained by the CO2 graph (as drawn).
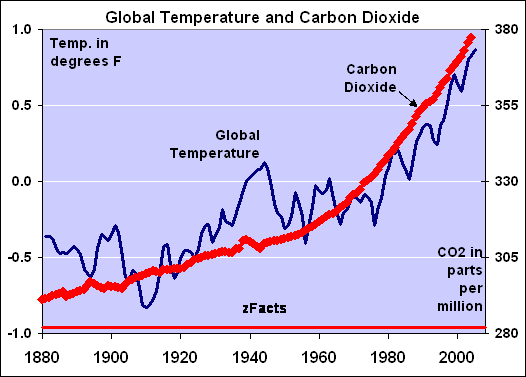
Fig 8: Caution: The match of the CO2 and temperature graph above is somewhat deceptive. Since one is temperature and one is CO2
So it is not exactly convincing.
However, even though this is unconvincing, the the graph above a lie.
The graph is bogus
The graph is in fact entirely bogus for the following reasons:
- no reliable CO2 data before 1958, so that portion of the graph is entirely fiction.
- Effect of CO2 is much smaller than suggested.
- Actual rise due to CO2 greenhouse warming is as shown below (blue line).
- The graph breaks down after 1998 as shown by my graph on the right.
If the graph had shown the actual greenhouse effect of CO2 it would look more like the graph below:
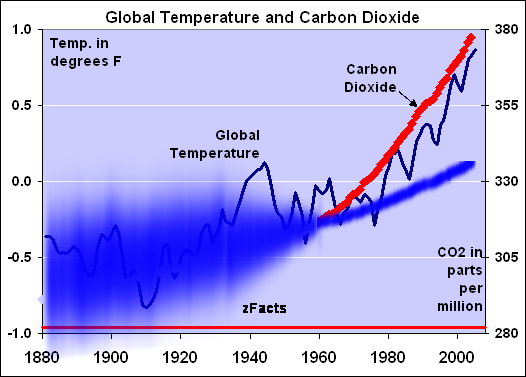
Fig 9: Real relationship – not known before 1958 and much less after
And as the graph below shows around 2000, the relationship broke down completely as the global temperature stopped warming whilst CO2 continued up.
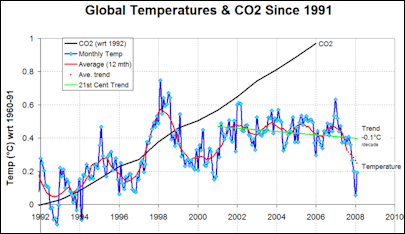
Fig 10: … and relationship breaks down after 2000
**Note, thanks to Jude Onwudili for helping correct this. Mysteriously it said 100ml


Mike I find this has not been put up on your own site. Are you giving me first publication rights.
Regards Neil
Thanks, but as far as I can tell it is accessible on the home page.
Encourage nuclear fusion?
In theory, that’s been about the holy grail of energy, all right, for 60 years. But so far it’s pretty elusive and likely not as cheap as hoped. (Lawrence Livermore’s years-long experiment in advancing hot fusion this year failed to fire, etc).
You may want to add forms of fission to the list, at least for now. That’s something we know.
Unfortunately fission still needs subsidy. Fusion is the only new energy source I know which has the potential to dramatically undercut present energy generation.
Mike I left you a message on BH, I might be able to assist with legal matters – I can’t see contact details here.
Pingback: These items caught my eye – 19 October 2013 | grumpydenier
What you seem to imply is that we could increase our GDP very simply by reversing all energy conservation measures taken over the last 20 years. That would increase our energy usage at a stroke. Great stuff, I look forward to seeing that in the UKIP manifesto!
Thank you very much for your comment, but you have missed the point.
These “energy saving” measures are all but useless because they are in fact “energy displacing measures” so that any energy saved is then consumed as the money saved is spent doing other things. In other words they do not change energy availability and therefore do not change how much energy we use.
The point I was making is that GDP rises as a result of increasing energy availability both at a local and global scale. So if we want to see ever increasing GDP we have to find news ways of providing ever increasing energy availability (and not subsided wind which are likely consumers rather than producers of energy).
What do you mean by “availability”? You say “It has been long known that we cannot have GDP growth without growing the availability of energy”, but figure 4 shows that UK and US GDP rose hugely between 1980 and 2002, yet energy use hardly changed. Did the availability of energy in those countries change?
Also your figure 7 shows EU GDP is lower now than in 1980. Where did that graph come from and how was it computed? Which countries have seen GDP per capita fall below 1980 levels? Maybe Germany’s GDP dipped in 1990 with reunification, but it is surely bigger now. How does the graph adjust for reunification and for expansion of the EU by taking in 10 relatively poor countries in 2004/7?
It is a difficult subject because of displaced energy usage. So e.g. if we buy a lot of goods from China, then the energy usage is in China and not the UK.
By availability I mean the total deliverable quantity of economic energy.
Another way to view this is I suppose it would be called: “energism” akin to “monetarism”. Monetarism was the belief that the economy could be constrained by constraining the money supply. “Energism” or “Enerconics” is the fact that it is constrained by energy availability.
The simplest way to view enerconics, is to think of the basic enerconic system which is a natural eco system. The energy input is almost entirely solar energy which is taken up by plants, and then herbivores eat the plants and predators eat the herbivores. These could be akin to energy suppliers (plants), manufacturers(herbivores) retail(sharks) and I suppose the banks are the fungi.
The primary energy capturers are located where the energy supply is. The herbivores live close to the herbivores. But the predators may live out of the sunshine. However, the number of predators is highly dependent on the energy from the sunshine.
Likewise, retail uses energy used in production in foreign lands.
So, to answer the main point, the key is the extremely close correlation between world energy availability and GDP. However, all the others show a close relationship. If there are problems, it is that we don’t properly track energy “stored” in materials and products … although as price is a good proxy we can (if careful that other things are equal & it is a free market) use energy and price interchangeably
The UK prides itself on how much CO2 it has reduced on 1990 levels but once imports are included our per capita energy consumption has risen. I suspect tht this is true of much of Europe. We’re also one of the few old European countries with a rising population so our overall emissions are still rising either way. The single biggest impact on UK energy use has been the recession. If we have less money, we spend less, travel less, do less.
That is not to say that all energy reduction is pointless. Loft insulation is mostly beneficial… until you need to do anything in the loft anyway. But I agree, under current human habits, the more money we save in one place, the more we spend somewhere else.
If people like Chandra want to change that they need to stop lying about it. People have to make the decision to use less, not be conned/forced into it. Pretending wind and solar works is the worst of all options.
Energy saving displaces spending from one area to another. It displaces energy use from going into heating our homes and into foreign holidays. In terms of reducing energy usage it is totally pointless, but in terms of transferring money and energy usage to things we might much prefer, it is entirely beneficial.
You didn’t answer my question about fig 7 and the conclusions you draw from it. It shows EU per capita GDPis lower now than in 1980 but you ignore the increase in population from the accession of 10 poor countries. It is this population growth that has caused the dip in per capita GDP, not CO2 reductions. Adjust for this (by omitting the new members) and your drop in pc GDP will disappear.
The figure shows GDP per capita. The point about the extra countries is a good one, however a comparison of energy usage & GDP in China & India against the US and EU does support the conclusion.
However, I would be more concerned with “displacement” energy use because this is far more difficult to account for.
So yes, you may have a point that I could have found more comparable figures, however we have multiple strands of evidence all pointing toward a close correlation and as I have shown raw material is highly correlated with energy used to produce that raw material. The next stage would be to prove a similar correlation within manufacturing and then distribution, but given the extremely good correlation between world GDP and energy I am confident that such a correlation will be found.
The important thing to my mind is that instead of talking about “economies” we can start thinking about “enerconomies”. This could be important in considering the following areas:
1. The economics of energy … which are largely dependent on the cost of raw materials which is itself dependant on the cost of energy. So, e.g. when someone says: “wind will become economic when energy prices rise” … they are really saying that “when the cost of energy rises, the price we get for wind will be higher than the price we pay for raw materials …. which is determined by the price of energy. So, they are saying “the price of energy (received) will be greater than the price of energy (paid in raw materials)”.
2. In ancient societies without money, there were still economies. Enerconics can be applied as easily to societies without money as those with and the measures (food, fuel) are one of the more measurable quantities rather than esoteric items of value like gold.
3. It can readily be adapted to natural ecosystems.
I know that doesn’t directly answer your question but is that OK?
Not really, but I don’t suppose I can deflect you from your chosen path. You might bear in mind that correlation and causation are not the same thing and that correlations have led many to false conclusions. Consider the correlation between ice cream sales and shark attacks for example.
Best wishes. C
You are right about correlation and causation, but assuming you take the opposite view isn’t that just what you are doing? You see a correlation between energy use and GDP and drawing a false causal link to suggest that rising GDP drives energy use?
Instead, I am starting from basic science … we need energy to do things. Therefore whatever we do needs energy and as GDP is a measure of activity, it is a measure of what we are doing and therefore a measure of our energy usage.
Another way to view this is to use the analogy of feeding birds. If you put food out for birds, you will get a lot of birds. Likewise, if you make a lot of energy available to societies, they will consume a lot of energy. The activity in the society or on your bird feeder is determined by the level of food/energy available (food is energy!).
In the western world, just as people have no idea about the food on their plate, so people have no idea about the energy content of the goods they buy. So, I can understand that you find it difficult to comprehend that everything we buy contains “used energy” which appears to be almost the same as “monetary value”. However, as I have shown the evidence is very compelling that energy used and monetary value appear to be largely interchangeable and GDP and energy usage appear to be the same thing.
However, just as sunlight isn’t always the sole determining factor of environmental growth as nutrients also play a role, so energy isn’t always the sole determining factor of economic growth, but it is certainly the dominant one from the evidence above.
For the Chandras of this world, the desired result is to force people to use less energy. For their own good… A better society in their eyes would be an old fashoned monarchy, where a few people enjoy a finite amount of riches (energy) and the rest receive enough to live on but no more. Our modern society of everyone increasing consumption is an anthema. Of course to say that in so many words looks bad, so they get very vague about what people will be allowed in their utopia. They talk about greed but never outline where need stops and greed starts. They have no mechanism for stopping people like Prince Charles and Al Gore from having everything they want while the rest of us plebs suffer. They’d like to believe that wind or solar will let us carry on as before, only paying a bit more for it.
Unfortunately for Greenies the revolution already happened. Us peasants like consumerism and everyone’s fed up with austerity already.
I believe that fission is not inherently expensive.
According to this a similar project to the £16 bn Hinkley, also built by Europeans to a European design is costing $7.5bn (£4.5 bn).
http://nextbigfuture.com/2013/09/european-nuclear-reactors-are-three.html
Add the fact that it will take about 3 years leaving 7 years less interest payments before there is a return and we get Chinese costs about 20% of ours. This can only be because of more government regulatory parasitism here.
Add in the fact that reactors could be mass produced much cheaper if it was allowed and I think we can reasonably assume 90% of nuclear fission costs are regulatory.
Government can make these costs anything it wants so if fusion ever became practicle the Luddites could and would use the same tactics there. The correct tactic is to expose the amount of parasitic cost on fission and everything else.
Pingback: America Needs to Use More Energy, Not Less | The Freedom Pub
Pingback: America Needs to Use More Energy, Not Less - Western Free Press
Pingback: America Needs to Use More Energy, Not Less - Big Sky Headlines
With regard to the higher cost of generating energy by wind, solar, tidal etc. As well as the cost of manufacturing the generation equipment, and ignoring their intermittency, the MOST important consideration is that the energy sources are of very low energy DENSITY.
Historically every change of energy source, peat-wood-lignite-coal-gas-oil-nuclear has grown gdp progressively faster because each was a change to a higher-density energy source.
It cannot happen again. The implications are staggering.
The simple fact is that wind and coal are both free in their natural state, but what costs is the capital costs of harvesting them (you effectively burn coal to run a coal mine – so there’s no running cost and it’s totally “free” – in the same way wind is supposedly “free”).
But the big cost, is getting all that energy from the source to where the customer can use it. So, obviously if it’s low-density, it will be high cost.
Pingback: America Needs to Use More Energy, Not Less - Capitol Hill Outsider - CHO
Pingback: American Manufacturing Needs More Energy, Not Less – Breaking News
Does 100ml of petrol actually contain 10000 kJ of energy? Sounds more like 300 ml instead, except I have misread your data.
Thanks for reporting the issue. But now I look at again, it’s still amazing as it’s just a cupful of petrol. Whereas a car can easily use 30litres in a day.
Or 20,000 miles at 40mpg ~= 2000litres which equates to the yearly energy consumption of 20 people.
Thus to have the equivalent wealth in the Roman period as driving 20,000 miles today, could be equated with a household owning 20 slaves.
Pingback: An ensemble model to sustain variability power in the theory of developmental pathways? | Scottish Sceptic
Pingback: Enerconics II | Scottish Sceptic
Good article. I think you are on to it. It was very difficult finding anything on this subject which tells me you are probably one of the few.
I had worked on this subject extensively following the financial crisis and at that time determined that money is the proxy for energy, the relationship is 1:1 and any apparent non-correlation was due to fiddling with money. A dollar today is not the same as a dollar yesterday even though the energy on both days is. This would make dollar/joule yesterday different than dollar/joule today. That’s only because the two dollars are different but have the same name. Confusion. I created a notional currency with a totally different name (call it the Buck if you want) to overcome this issue. Then I could talk about the physics of the Buck/joule (invariant over time) and not the dollar/joule which was constantly changing.
If you want to clearly show the physics of money being a proxy for energy, I could only get meaningful results when I compared global GDP (converted to US dollars) versus global energy consumption (all forms and shown in joules). Doing this eliminates all the local variations and the physics shines through.
Since global GDP is 1:1 with global energy consumption, by definition, it is clear that global inflation is simply the increase in the global GDP *relative* to global energy consumption. For example, global GDP that decreases at a slower rate than the reduction in global energy consumption would be inflation, or global GDP that increases slower than the increase in global energy consumption would be deflation. You can work through the other permutations. Bottom line, this gives you a definition of inflation/deflation that is bound by physical law. Maybe that’s useful to you? No-one else seems to have any idea what inflation is.
There’s a lot more to be discovered if you follow the implications. I have all my sources, analysis and findings if you are interested.
Cheers,
Steve
Thanks for the comments. My original aim was to find a way to describe both primitive (before money) and the complex economics in a way that they could be compared. Clearly traditional economics cannot be used before money, so I reasoned that you could you energy. However that led me to an interesting question which is the price of energy. Because if energy=price then what does this means in terms of producing energy.
From that point I realised that the relationship is slightly more complex: Price = Energy x Enerconic_multiplier.
The reason for this is that we often put energy into the production of something and then reuse it. For example, we build houses and then stay in them, not one night – but over many many years.
And it turns out (from my first calculations) that on average we reuse each bit of energy about 4x in the economy. In other words, on average each kwh is sold about 4x in various ways before it is lost to the economy.
For more see: http://scottishsceptic.co.uk/2017/03/23/the-enerconic-or-society-energy-multiplier/
Hurrah, that’s what I was looking for, what a data! present here
at this website, thanks admin of this site.
Pingback: What If There Isn't Enough Energy Going Forward? | Alternative News und Medien
Pingback: What Does Cold Weather Teach Us About Economics? -OR- Lessons Kids should Learn about Energy – FREE MARKET KIDS, LLC
Pingback: Teaching Modern monetary theory (mMT) to teens – What Can We Learn from ~2 Trillion Dollars – FREE MARKET KIDS, LLC
Pingback: Enerconics and the effect of Net Zero | Scottish Sceptic