Summary
Can I see anything except global greening that’s due to CO2? I can honestly say No. And anyone who says they can see any change due to CO2 is crackers. In contrast, I am now reasonably confident that Environmental Action in the 1970s was the major cause of post 1970s warming and that the preceding increase in pollution may well explain the global cooling scare.
Intro
See also: previous article that lists all other articles in this series
If I were an alien looking down on earth, the only noticeable change that I could detect as a result of rising CO2 would be a greening of the planet which leading to increased harvests has been undoubtedly a good thing.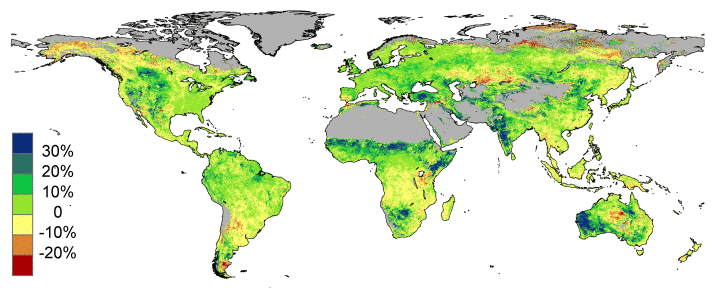
However, as a scientist looking at the global temperature I still fail to see anything I can attribute to rising CO2. The closest I have come is the changing temperature profile of the atmosphere as shown by meteorological balloons. The following shows how the trend since 1960 is distinctly different with height (height is given in atmospheric pressure. So 30 is the highest level and “surf” is the surface):
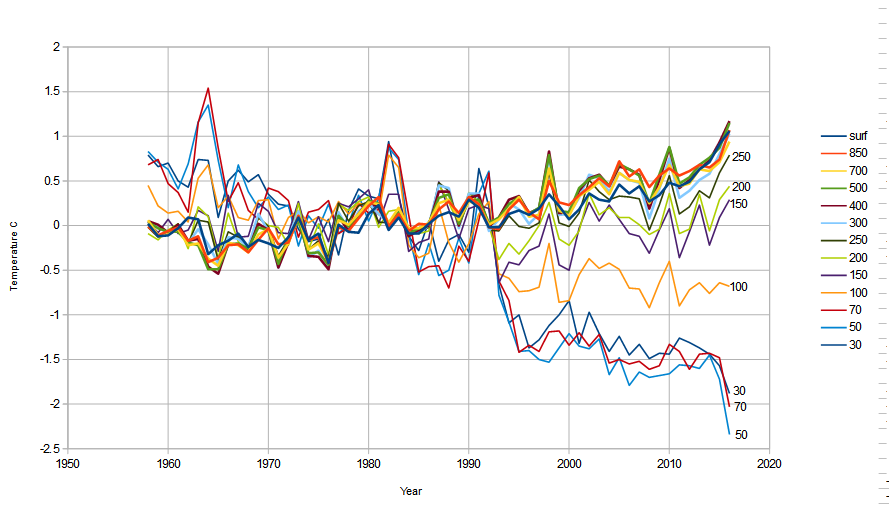 The most significant part of this graph is that prior to the 1970s clean air acts. However whilst this continues to show a clear trend above the 100mb pressure height, temperatures below this heigh appear to be in a “pause” (1960-1975) and there is even a suggestion of a cooling phase from 1960-1965. So, we really need another few decades prior to 1960 to see what is going on. Let’s put it this way: it’s not inconsistent with CO2 warming, but neither is it inconstant with “Environmental Action Induced Warming” (I.e. the introduction of clean air acts in the 1970s here shortened to EAIW).
Whilst this trend appears to have existed since at least 1960, what I have consistently found in other measurements is a change occurring from 1970/80. For example the discrepancy between global sea and land surface temperature: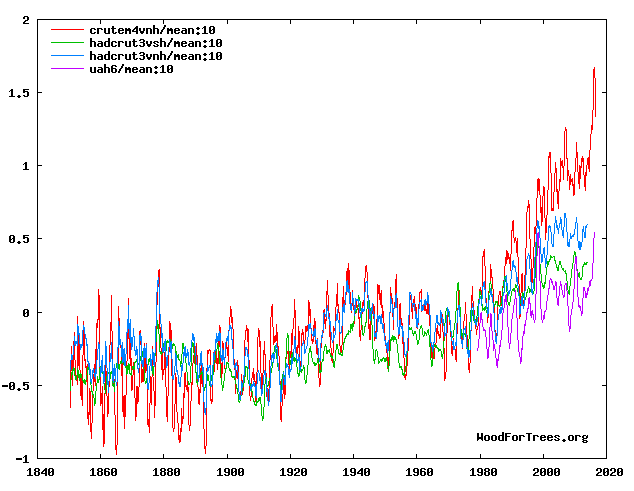
These suggest a significant effect has changed the global temperature, but ONLY IN A WAY THAT IS DRAMATICALLY DIFFERENT BETWEEN THE LAND AND SEA. This is completely inconsistent with the CO2 hypothesis. And indeed it is so obvious in the temperature records – and indeed it appears to be well known as it is one way those like NASA to put a “thumb on the scales” of global temperature.
In other words, they are knowingly using something that changed land v. sea tempeatures since the 1970s/80s and cannot in any way be ascribed to CO2, in order to boost global temperatures and then use it to suggest it was “CO2 wot done it”.
The reason I can say it is not CO2 is because the warming since 1985 has been very regionalised:
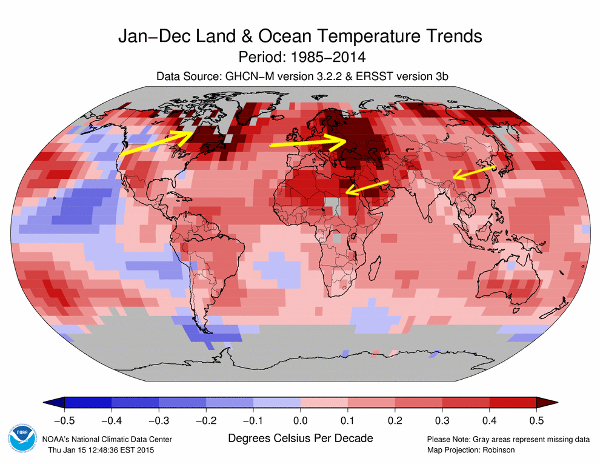
Note: whilst I talk at great length about “hotspots” – any such graphic will undoubtedly contain massive natural variation. Most of the change shown is around 0.1-0.3 so a 0.5C “hotspot” could just be a natural variation of the distribution of heat.
And it is particularly important that the big hotspots are downwind from industrialised areas. This strongly suggests that either something we are adding to the atmosphere is causing it to warming, or something we used to add to the atmosphere used to cause cooling but has now been removed (I.e. AEIW). And we know this is not CO2, because CO2 is well dispersed globally, and this effect is about 3-8days downwind given the prevailing wind speed. In other words, it is the typical time for pollutants to be washed out the atmosphere by rain. Which itself strongly suggests the particles are important in forming cloud droplets. And in turn makes the strongest contender some form of pollution that used to increase cloud cover and block out the sun.
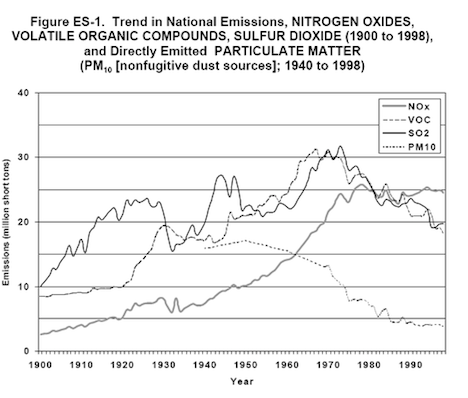
This graph clearly shows the rise in pollutions up to the 1970s and then the consequential sharp reduction from that period to present.
So, we have two strong lines of evidence: first the clear departure of land and sea temperatures which (although I’ve not checked) do appear to be well above the normal variation between these two metrics. And second the very regional hotspots. Put together with what we know about the emissions of pollutants peaking in the 1970s and dropping since, this is very strong evidence for pollution induced warming and as such we can effectively ignore the heating from 1970s onward because it is hugely contaminated by EAIW.
CO2 Warming
But what intrigues me now, is whether we might use a similar argument to say that some of the warming we see must be due to CO2.
But first, let’s recap the importance of natural variation. The simple fact, is that taken on its own there is nothing at all to suggest the long term global temperature has changed in an abnormal way. So, on it’s own, even the post 1970s warming is not large enough to trigger the threshold of “something abnormal”. It’s only because the effect is concentrated in regional hotspots that I can say with some confidence that something has happened. Without something like this all the changes we see in the global temperature are what we would expect from a system with normal natural variation. That does not mean, however, if we see a period of warming, that it cannot be due to CO2. It is just that there is nothing abnormal in seeing a period of warming – and just because it warms cannot on its own be used to suggest it was caused by CO2.
So, let me go back to my “best reconstruction” of global temperature from 1680 (the vertical lines are ever 50years).
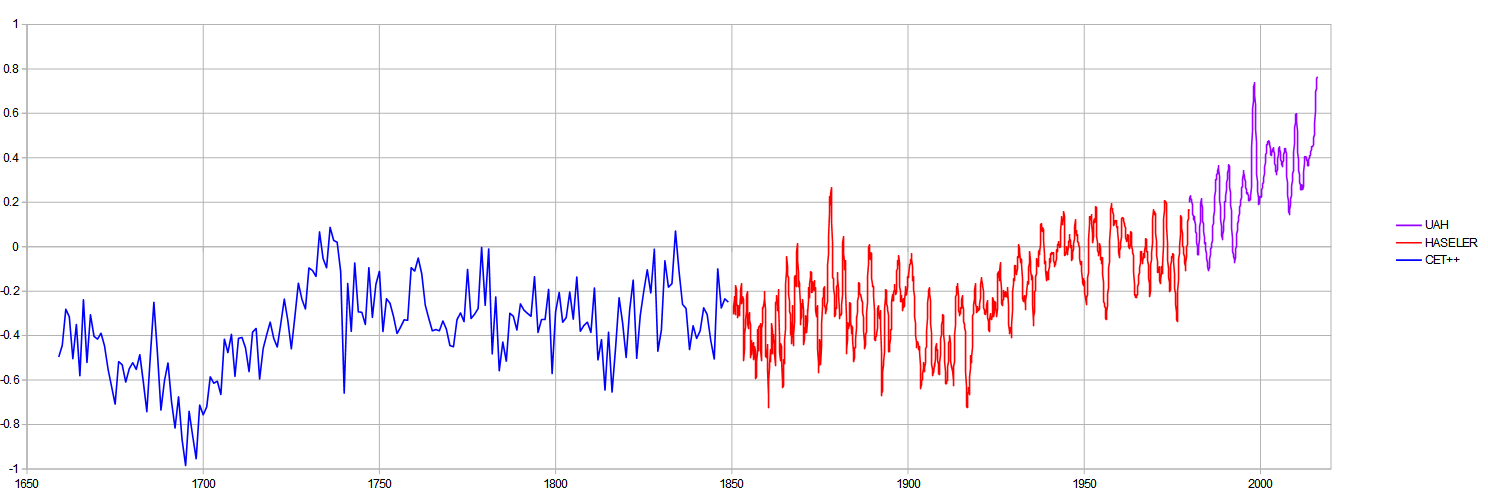 The period with EAIW is roughly the purple period (satellite record). This means that any signature of CO2 warming would need to be found – roughly in the red section (when enough measurements are available for a global temperature). What we can say, is that if we ignore everything before 1750, we could say (unscientifically) that there’s been a change of about 0.2 to 0.3C from the period 1750-1900 to 1950-1970. This however compares with a ~0.4-0.8 C change from 1690s-1740s. In other words the scale of change is around half that of peak natural variation and therefore the 0.2 to 0.3 C change is too small to attribute to any cause with any certainty.
Time for Best Guesses
What I’ve said so far I can say with confidence. But it is possible to say “ignore confidence – just give me the best guess). So what follows is an attempt to come to a best guess.
Looking at the global map, the areas well away from trade wind driven pollution seem to have warming of around 0-0.2C/decade. Therefore as we’ve seen about twice this warming of 0.4C warming from 1984-2014, it’s reasonable to suggest that the background (far from pollutants) is due to global temperature effects like CO2 or perhaps solar and the rest to EAIW reduction in pollution. So my best guess is that half this warming was caused by the reduction in pollution and half by “general warming” as would be expected from CO2.
However, there is also the possibility that contrails are leading to warming. But looking at the regional temperature trend map, I cannot detect the necessary regional warming, particularly in long distant routes. So, this effect whilst probably present may be far too small to measure (unless we have another 911 type event).
I’m also persuaded by those who suggest a correlation between global temperature and natural cycles like AMO. Although this is hugely complex, because they may be mistaking EAIW with warming from AMO. There is also very likely a solar contingent:
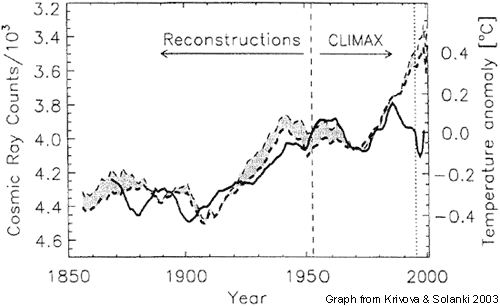 However, perversely as drawn, this suggests that solar on its own would have led to a cooling of climate by 0.1-0.2 C from ~1980. In other words, the world is now cooler than it would be without solar because of a 0.05C cooling trend. Or the trend without solar from 1985-2000 is best estimated to be 0.4/15 = ~0.25/decade warming. At this stage I can extremely tentatively attribute contributions to the warming trend as follows:
- Background: 0.15C/decade
- EAIW: 0.08C/decade
- Contrails: negligible
- AMO (etc): 0.03/decade
- Solar: -0.05C cooling/decade (1980-2000)
Total trend 0.2/decade – which would be at the limit of what is expected from natural variation. However, rather than “CO2 warming” I actually have a figure of “general background warming” of about 0.15C/decade. This is about 3x the warming we expect from IPCC calculation of CO2 warming (0.5C/decade) and 4-5x what is expected from a better source (Hermann Harde gave a figure of 0.6C/doubling of CO2). So I would suggest around 0.03 to 0.04C can be attributed to CO2 directly.
In addition, I have to include a budget for “thumb on the scales” type warming of perhaps 0.2C. If we attribute this to a 40 year period this suggests 0.05C/decade warming is due to this cause. So, my final CO2 budget (for 1980-2000) is as follows:
- EAIW: 0.08C/decade
- CO2 0.03-0.04C/decade
- Thumb on the scales: 0.05C/decade
- Contrails: negligible
- AMO (and other identifiable natural cycles): 0.03/decade
- Solar: -0.05C cooling/decade (1980-2000)
- Unattributed background ~0.12/decade
Feedbacks
You’ll note I have not included any figure for “feedbacks”. This is because the effects above are first order effects – and these are almost impossible to measure. But feedbacks are second order effects and if we can’t measure the first order effects, we are talking cloud cuckoo logic to start wittering on about feedbacks.
To put it ALL INTO CONTEXT
when I did temperature measurement for a job, the only one of these large enough to measure (0.1C) is “unattributed background).
These figures are so small that you’ve got to be mad to do what I’ve been doing here and try to ascribe them to specific causes. I’d say there’s a very small chance of those figures being even within 50% of the “correct” value (“correct” is a very dubious term with something so complex).
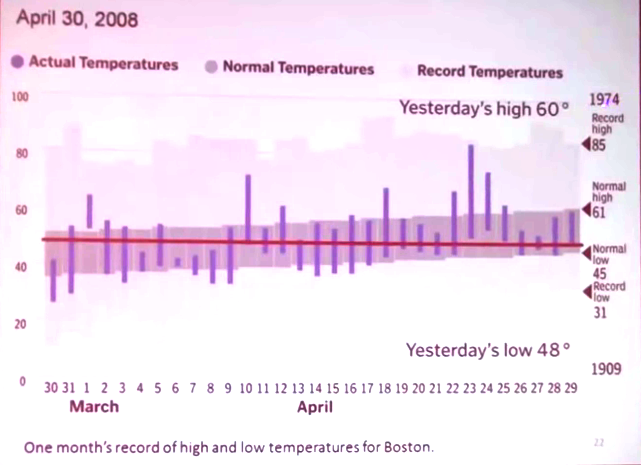
And to see what it all means in context of a normal day. This graph shows daily and seasonal changes. And ALL changes to global temperature that have been falsely attributed to CO2 can fit well within that thin red line.
Conclusion
The purpose of this article was to see whether, if I used similar criteria to that I used to attribute the hotspots to pollution, I could realistically attribute some of the warming to CO2. The answer is unequivocally not. The problem is that being a well distributed gas and with a slow increase which gives no specific “features” that ought to show up in any effect, it is impossible to attribute a rising temperature to CO2 because there is just so much else going on that could also give rise to a temperature change.
Instead I have to fall back on calculations of what the effect ought to be which is around 0.03-0.04C/decade warming. Given that I estimate the Environmental Action Induced Warming (as a result of 1970s clean air acts) to have twice the effect of CO2 and it has a very specific behaviour (increasing to 1970s and then reducing) but even EIAW is hard to measure, I have to conclude that there is nothing at all I see in the actual records that I can even with a low confidence ascribe to CO2.
So,


Pingback: Understanding Global temperatures X – 1970s Global cooling and 2000s Pause | Scottish Sceptic