In the last article I asked people to undertake a quick test (see here) and thanks to all those who took part – it’s started to answer the very simple question: if a lot of people drew a line through some points how close would an average person place the line to that of a computer. But I’m leaving open the question of whether the computer line or human is “right” because its a difficult one.
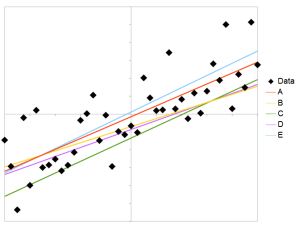
A typical test was as follows:
 The graph consists of 51 points. The graph scales are -1 to 1 (x-axis) and 1.2 to 1.2 (y-axis).
The user was asked to select the best fit line to the points. One line was a best fit, the other lines had random offset added up to +/-0.25 and the gradient was increased by a random amount up to +/-0.25. Thus on average one end of the line would be around 0.25 from the best fit line. The standard deviation of points around the best fit line was about 0.3.
After 16 responses, the answers were checked. The results are as follows:
- On average people selected the calculated best fit curve 48% of the time.
- In 10 out of the 11 questions, the most frequently selected line was the best fit. (the odd one out was the first)
- In those 10 questions where the best fit was most frequently chosen, the best fit on its own was selected 52% of the time, and the best fit and second most popular was selected 75% of the time.
- There was a very marginal difference between those claiming to be engineers and scientists (average right of 6 and 5.6 respectively)
- There was a very marginal difference between the lower education qualifications and highers (~0.8 more between school qualified and post graduate qualified)

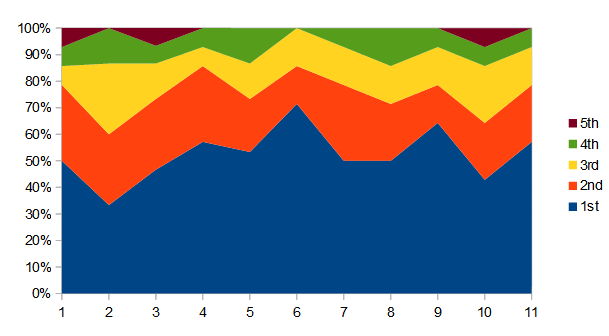
Answers stacked according to relative frequency with most popular at bottom. This shows around 75% of respondents picked the most popular or second most popular choice. Note the most popular choice on the first was not the computer best fit line.
Conclusion
At this stage the differences between the nominal groups are insignificant. So, the significant finding is that in the test, people were not picking the computer’s “best fit” around 50% of the time. This does not mean they got it “wrong” – because people may use far more complex criteria than a simple computer.
But the result begs the question: how big a difference was there between the best fit and the next best?
I calculate the difference between the nearest gradient and nearest average offset to the best fit will be about 0.1 times the standard deviation. However, a line is unlikely to have both the closest gradient and offset. So another way to compare the lines is to use the “biggest deviation”, which will be the offset + gradient contribution at the worst end of the line (where offset and gradient both tend away from the best fit line).
By my calculations, the way I’ve set it up in the test, the nearest line should be about 0.2 x the standard deviation away from the best fit at its worst end.
Details
The points are created as follows. Where rnd(a,b) is a random number between a and b.
- Y1 = rnd(0,1)
- Y2 = Y1^1.6 (with a random sign)
- Y3 = 0.7 * Y2
- Y4 = Y3 + rnd(-0.2,0.2) + rnd(-0.7,0.7) * X
The lines are drawn as follows:
- A random line matches the slope and average of the points
- All other lines have random offset and gradient of rnd(-.25,.25) and rnd(-.25,.25) *x
Calcs
- The combined worst end standard deviation along the line from -1 to 1, will be twice the average standard deviation (0.125) = 0.25.
- If we assume the lines are evenly spaced, (by my estimation) the closest line should have a maximum offset about 0.25/4
- If the point standard deviation is 0.3, the the average end of line difference is (0.25/4)/0.3 = 0.2

