There’s been some really appalling articles prompted by the idiot Mann who makes a frankly fraudulent claim (if it weren’t for the fact he’s so stupid he doesn’t realise how wrong he is) about the probability of getting a record warm temperature naturally.
So, I thought I would try to work it out based on the statistics of systems like the climate with 1/f type noise. However I don’t intend going over it in detail again so if you want details of 1/f type noise and how its stupid to try using Mickey mouse statistics on it here’s a few articles:
- Introduction to 1/f climate noise
- Proof: recent temperature trends are not abnormal
- Statistics of 1/f noise – implications for climate forecast
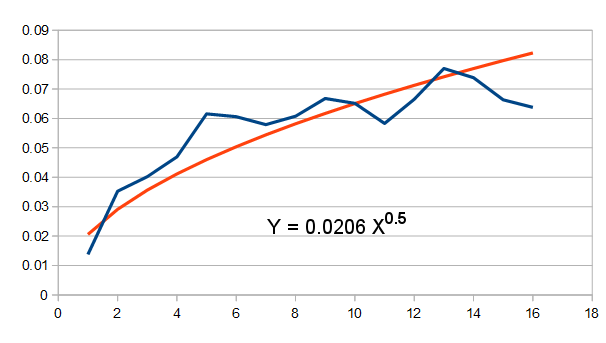
But fundamentally, the key nature of 1/f noise is that the variance INCREASES with longer periods. Below e.g. is a plot (I produced this using a 1/f type noise generator ).

Now for some stats. Given the above, if there’s a 95% probability of having a temperature of T0 in period P0, then as variance increases by P0.5
Then the temperature that occurs at the 95% probability limit (T) in a period P is given by
T = T0 * (P/P0)0.5
In other words (and ones Mann might understand) we expect both higher and lower temperatures over longer periods.
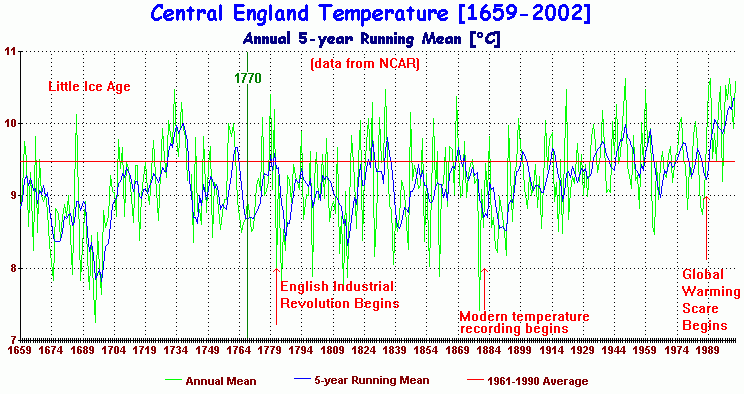
 So, lets see how that pans out with real data. Above is the best proxy for global temperature over the last 350 years. If we divide this into two, we see that the range in the first half went from around 8 to 10 = 2C (from 1690-1730).
Based on the rule above, we expect that minimum-maximum range to be 2 x 20.5
Or to increase from +/- 1C in the first period to be +/-1.4 over the entire period. Which tells us that on average the maximum we would expect is about 1.4 above the mid point of the first half (~9C) which means we EXPECT a high of 10.4C
Looking at the Met Office data I find: “Average for 2015: 10.31C”. Which given the variance was higher than 2C means we are actually below expectation for the highest this century.
In other words, 2015 was exactly (or slightly less than) the maximum we would expect for 1/f type noise based on long term trends.
In other words the likelihood of the current temperature within the last 350/2 years is around 50% (half the time it would be higher half lower). In other words even this simple analysis shows that there’s a very high probability of having temperatures this “high”. Or to turn it around we’d be surprised if we did not see a temperature this high and it would not be that unusual to get significantly higher.
If however you add these facts:
- All the warming from 1940s is attributable to the massive adjustments to the data Mann uses
- IN ADDITION urban heating adds to that with an ADDITIONAL warming trend
- IN ADDITION poor siting of stations has caused addition warming
- IN ADDITION there is undoubtedly fraudulent changes to individual station data
- IN ADDITION there are intentional changes to the method of calculating the figure and selecting sites in order to manufacture further warming.
We are getting to the point where it is almost certain that 2015 would be the highest temperature on record – because (in my opinion) if the fraudulent people using this bogus & knowingly poor quality surface in preference to the much superior and global satellite data data wanted it to be – they could also make it the coldest year of record.
So what does the idiot Mann say:
the likelihood that 13 of the hottest 15 years would be in the past 15 years is 1 in 10,000. The likelihood that 9 of the 10 hottest years occur in the past decade is 1 in 770.
In case it isn’t blindingly obvious how this trick works let me show you:
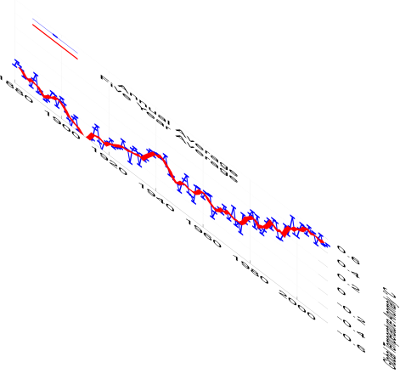
Here is my own new improved version of the global temperature where I’ve now “compensated” for all the introduced warming by adding a completely arbitrary cooling (which just happens to make this year coldest):
Now, like Mann, I can confidently assert using the same buddy reviewed work that there’s only a 1 in 770 chance that the temperature would be this low. And like Mann as a Nobel prize winner I now expect to receive millions in grant funding based on my “science” (the EU were awarded the Nobel – so as a very reluctant part of the EU – I can make the same FALSE claim to have a Nobel). LOL
Addendum
Also – because natural variation is a 1/f noise it tends to stay high once it is high or stay low when low. So if one year this decade is high – it’s a pretty safe bet that they all will be on the high side. So, it’s a pretty meaningless statistic looking at individual years.
The best way to approach the question is that I presented in this article: Proof: recent temperature trends are not abnormal. (in terms of statistics – this again confirms around 50% probability of getting this very normal temperature/trend – using a range of time periods for comparison)


Yet another case of lies, damned lies and statistics in the wacky world of climate ‘science’.
Fortunately for these alarmist characters, much of the media is either too heavily biased in their favour or too thick to see what’s going on – or both.
The reduction in weather stations around the World was justified due to the higher quality data that was being returned by satellites. Now they are ignoring everything but the surface data in order to continue pushing the Climate Change myth.