In this article I explain why the evidence shows we are unlikely to get runaway global warming in the present inter-glacial period and propose a simple mechanism.
Recap
So far I have proposed a timing mechanism explaining the long period of the ice-age cycle, a means by which CO2 (or other gases) could be released during this cycle due to expansion and contraction of the earth’s crust and then I have look at feedbacks and climate stability explaining that for the climate to go through cycles there must be positive feedback present.
See also:
- Introduction
- Criteria for Cycles
- Global warming and earthquakes
- Thermal crust expansion, decomposition and the Carbon cycle
- Overview of feedbacks
- Climate stability
Hitting the buffers
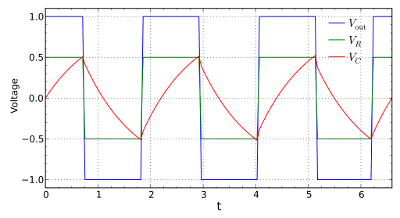
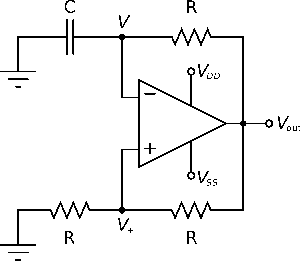
To go back to figures 2.3 & 2.4 (see Criteria for Cycles) we saw that in a typical astable oscillator, the system can have very high levels of feedback such that theoretically it would continue to increase without limit, but that in a practical circuit, the signal is normally limited by the power supply voltages.

Fig 2.4 Block diagram of a feedback oscillator circuit to which the Barkhausen criterion applies. It consists of an amplifying element A whose output vo is fed back into its input vf through a feedback network β(jω).
So, rather than the theoretical sin wave for the oscillation, the output is “clipped” by the available power supply so as in this case to form something very close to a square wave. But in effect this is a very very large sin wave where the value is limited between -1 and +1V.
In this way, the system fulfils the requirement for oscillation with positive feedback, but the signal is limited by “clipping”, which effectively creates massive amounts of negative feedback as the output signal approaches either supply rail.
The important point I would like you to note is how (in this case) the upper and lower level of the signal is clipped to a specific voltage so that each cycle reaches the same limit, stays there for a while and then retreats. And note how constant this level is. In this system with very little noise, the levels is identical except for a small amount of circuit noise. So, when we see such a sharp and constant limit, this is symptomatic of a “clipping level” or a level where there is a dramatic change in behaviour and large negative feedbacks come into play.
The clipping level
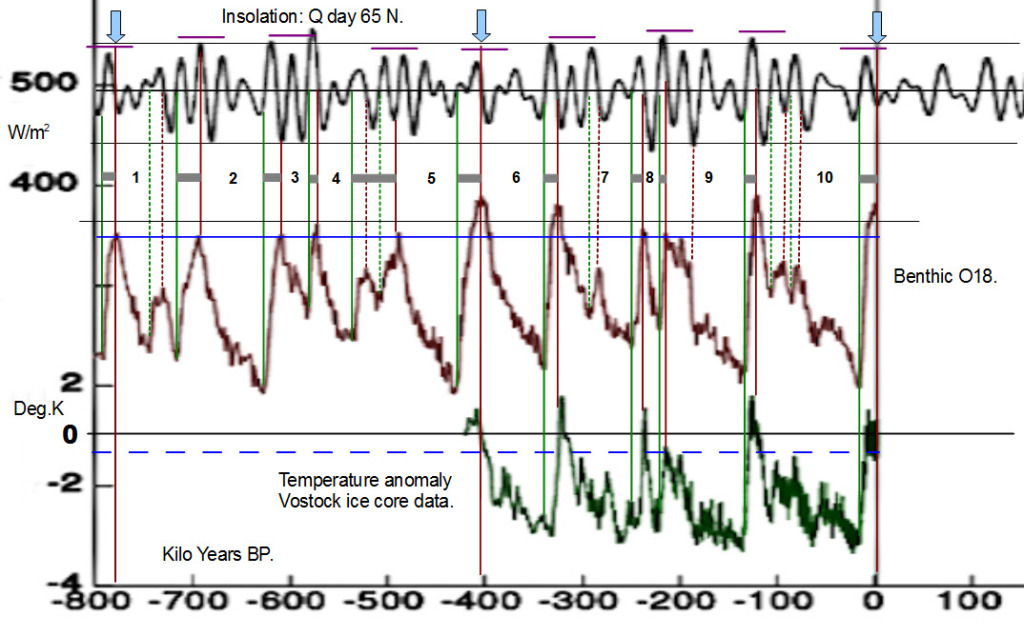
If we take the Vostok ice cores, look at temperature and draw a line across as in the green trace on fig 7.1 we find that there is almost a uniform maximum level to which the temperatures rise in the interglacial. Likewise, if we look at another proxy for temperature (Benthic O18 in brown) and draw a similar line, we find that again the maximum proxy temperature, this time over a much extended period has a very well defined maximum (albeit there is a discrepancy between two halves which appear to either have been shifted with respect to each other or for some reason this limit has changed).
This fairly constant upper limit to temperature is highly indicative of some kind of threshold in the climate such that the behaviour changes from being dominated by strong positive feedbacks (and hence a large swing in the middle) and then changing sharply beyond a certain point so that there comes into play massive negative feedbacks which make it very difficult if not impossible to go much beyond a certain temperature.
What could cause this shift in behaviour from positive to negative feedbacks
We need something that changes sharply at a well defined level. I have already said that there is a large body of evidence that the climate was drier during the glacial period and I have already suggested that there could have been changes in Hadley cell structure leading to dramatic changes in climate and effective positive feedback. But changes in the Hadley cell structure appears unlike to be responsible. Because these are a step change and if they were responsible for creating effectively large positive feedback resulting in the large swings in temperature they are unlikely also to be introducing the strong negative feedback in order to “clip” the signal and create some kind of “buffer” stopping further warming.
But water vapour is an entirely different beast. Because whereas water vapour in the atmosphere is a greenhouse gas and so increasing it creates further warming, there is only so much water vapour the atmosphere can hold, and when that limit is exceeded, the water forms clouds.
Usually climate models ignore the impact of clouds. However Prof Hermann Harde found that when he included clouds in his model:7
Without clouds and maximum lH = 4W/m2/°C we find a climate sensitivity of CS = 0.72 °C; at mean cloud cover and with lH,max = 5W/m2/°C it reduces to CS = 0.3 °C, which corresponds to an attenuation by a factor of 0.56. So, latent heat can contribute to significant negative feedback. In this context it should be noticed that generally evaporation and convection feedbacks are not mentioned or included in climate models considered by the IPCC, although obviously they have a quite strong influence on the adjusting temperature levels. (Harde 2013)
Is the evidence for increased cloud the absence of dust?
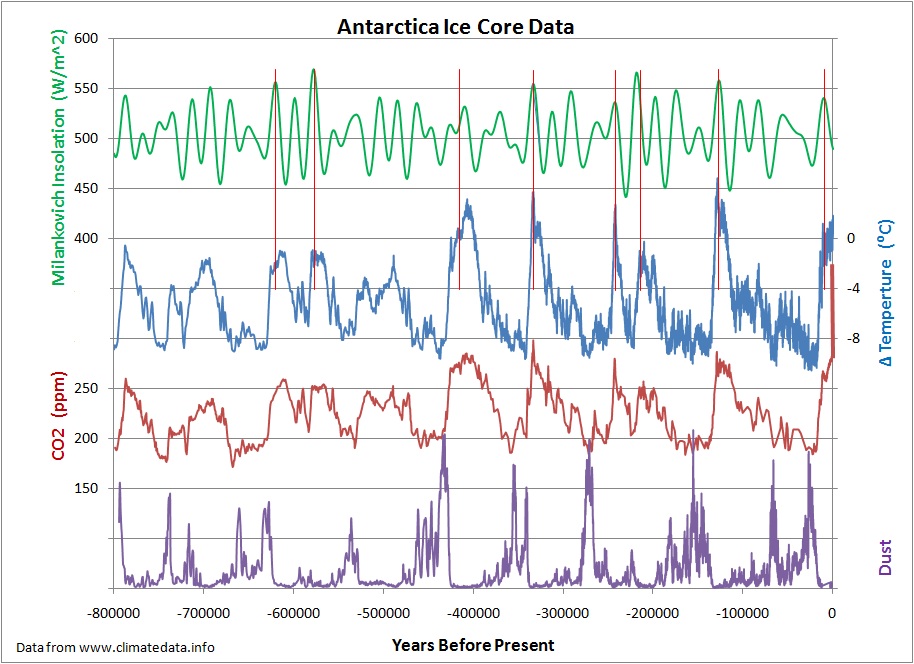
Below is a plot showing the familiar temperature changes through the ice-age cycle (blue) together with CO2 (red) and insolation (green). However in addition this plot now shows the level of dust found in the core (bottom purple)
What is noticeable is the amount of ice-core dust tends to be the inverse of the temperature and CO2 levels. As the temperature falls to a minimum, the dust level seems to rise to a maximum, when the temperature is a maximum in the inter-glacial, there is no dust. And the change from dust to no-dust is very sharp and in most cases clearly coinciding with the rise in temperature
One very good explanation for this rise and fall in dust (but not the only one) is that the dust levels are changing because of land surface humidity. (the other explanations are change of wind pattern/strength or distribution of dry areas).
This pattern of sudden reduction in dust as temperatures warm suggests that the world surface got wetter, which then suggests that there was more cloud to precipitate rain.
As can be seen by the very constant maxima of the temperature in the interglacial, if this is the effect of cloud formation it is so massive that it completely stops further increase in temperature – and with no ability for the atmosphere to hold additional water vapour, there is no additional H2O induced greenhouse warming. In addition if this “buffer” is caused by a rapid increase in cloud cover, this stops incoming radiation. Together these two feedbacks effectively prevent any further warming during interglacials.
This would allows the earth’s near surface crust to stabilise, and eventually expansion stops and the further release of CO2 from subduction processes ends. At this point the earth slowly begins to lock up CO2 thus repeating the cycle of decline into the next ice-age.
See also:
- Introduction
- Criteria for Cycles
- Global warming and earthquakes
- Thermal crust expansion, decomposition and the Carbon cycle
- Overview of feedbacks
- Climate stability


Some ideas to round out your scenario –
If you accept the Vostok core analysis, during glacials CO2 is close to starvation level for land plants. This with aridity is a known double-whammy, so deserts are expected. Your scenario has a switch to high-CO2/low-aridity, so rapid colonisation of arid land is expected. Consider where the modern “greening” is most apparent.
If “you cut down the trees, you cut down the clouds” is true, so is its converse; there should also be rapid increase in *continental* cloud cover.
The “increased evaporation = increased greenhouse effect” argument is hopelessly simplistic, so I advise against making it an important element.
re your first post on this –
From what you write I suspect you’re thinking of CO2 level as a result of an (approx) equilibrium process. This may not be the best view.
The ocean CO2 source and sink regions are geographically and climatically distinct, so there’s no reason to suppose that a change in one will even approximately be tracked by the other. The preliminary OCO-2 map is suggestive.
On the impact of reducing CO2 on plants, it would be best to wait until tomorrow’s article which covers just this subject!
On the second – that’s useful information. But in terms of the ice-age cycle, the CO2 levels are pretty well fixed and not too dissimilar to temperature. So, it’s not difficult explaining the level of CO2. The problem is explaining the temperature as a consequence of CO2 or any other known changes.
Pingback: Toward a new theory of ice-ages IX (Drying of climate) | Scottish Sceptic
There may well be something to your dust hypothesis. Worth looking into more closely and carefully.
See my previous extensive comments on your crust/volcanism idea. I don’t think that is correct. And provided several lines of observational evidence to discount it.
Pingback: Toward a new theory of ice-ages XII (The Haseler Gap) | Scottish Sceptic
Pingback: Can variations in lapse rate & cloud cover explain ice-age temperature changes and the inter-glacial “hard stop”? | Scottish Sceptic