My grand theory of the causation and progress of ice-ages was making steady progress before Xmas until I hit a small snag: CO2 levels do not work as a greenhouse gas! But neither do they just respond to temperature!
I’ve been thinking about it for a while without making progress, so I’m hoping that writing this article will stimulate some ideas to get around the log jam.
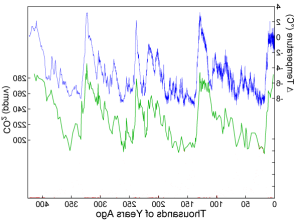
To recap re the evidence. We have a 400 thousand year record in the vostok ice as shown above. From this we can derive changes in CO2 and temperature (But please note both are proxies and not direct measurements as Salby showed).In general, this ice-core record shows a saw-tooth cycle of around 100,000 years with a sharp increase in temperature to a maximum, followed by a relatively slow decline and then back into the next cycle.
And it is undoubtedly this relationship which is the key stimulus for the extremely high predictions of the effect of changes in CO2. Because the derived change in temperature is around 8C for a 40% increase in CO2. If taken at face value this might lead the unwary into believing the climate sensitivity for a doubling of CO2 is around 16C. Whilst I don’t know anyone whose used this figure directly, I’ve no doubt that this apparently high climate sensitivity seen in the Vostok ice core encourages the rash estimates of extremely high climate sensitivities which are prevalent in most forecast models.
However, even if changes in CO2 levels are responding to changes in temperature and not changes in CO2 causing changes in temperature (and there’s ample evidence CO2 responds to temperature as CO2 lags in the record), then either way we expect to see correlation (albeit with a time lag).
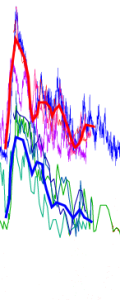
However, my problem began when I started looking at curves in detail. Because this below is what I found.

Here I have overlaid the four cycles shown in the Vostok ice-core by eye to show how all the cycles have a similar shape and then I have overlaid (by eye) the average of the cycles.
As I said, both temperature (top-red) and CO2 (bottom-blue) have a sharp rise, this then peaks and then OVERALL there is a drop, and the lower CO2 curve does fit this general trend with a fairly steady drop. But in contrast temperature behaves very differently. It appears that global temperature after rising sharply to the peak, then had an almost equally precipitous decline into a trough around 16,000 years after the peak.
AND THIS DECLINE IS NOT MIRRORED BY SIMILAR CHANGES IN THE CO2.
Far from having to explain why CO2 rise and fall together, I’m now faced with a much more difficult challenge: to explain why at some times they appear to rise and fall together, but during this critical post-peak phase, they lose this correlation almost completely.
In other words, not only does CO2 lag temperature, but at key points of the cycle, there’s no relationship at all. So, the idea that CO2 somehow determines temperature is totally bogus. But almost as bad, the idea that CO2 just follows temperature is also bogus. The truth appears to be that if there’s any relationship at all, this relationship CHANGES during the post-peak phase. And as yet I don’t understand why.
Any ideas?


“Any ideas?”
Well, you asked.
In my view, CO2 has nothing much to do with temperature at all. So, some other factors (I have my own favorite candidates) cause the rise and fall of the temperatures. Note, I do think that there are several factors involved.
The rise and fall in temperatures effects the oceans, life in the oceans, and life on the planet’s surface. The life is effected in various ways and not always exactly the same in each cycle so you get different CO2 levels caused by both the oceans temperature and by the CO2 use of planetary plant life.
If part of the equation of the cycles turns out to involve volcanoes, then obviously the CO2 would not always follow the same path in each cycle.
And the above is worth every penny that you paid for. 🙂
Regards, Mark
Thanks – a very intelligent reply.
I’d love to hear your list of “favourite candidates.”
However, it’s also really useful to know that I’ve not missed something obvious.
My wild guess:-
There is something big missing from models. If warming was just a feature of insolation, global warming gases and aerosols, then in broad terms we should be able to plot the last ice ages in very broad terms. Next they could plot the Holocene. If they could do those things they’d be trumpeting them from the roof tops. The only thing that changes rhythmically is insolation and it’s not fully consistent with global temperature. Sometimes peaks in insolation have almost no effect while other much smaller rises spark a full interglacial. Falls in insolation don’t always match the falls in temperature. Sometimes the effect seems to precede the solar trigger, though that may be dodgy proxy alignment.
On recent observation, I doubt CO2 or aerosols are causing the anomalies. I think the sun does something else. Whether it’s UV, neutrons or something weird with magnetic field I don’t know but I think it causes changes we haven’t got measurements for so far. I also think that the sun affects wind and coulds, moving the jet streams and the major weather tracks. These in turn probably also influence the ocean currents, cooling or warming areas of ocean and land; more or less clouds and rainfall.
We’ve never seen a full warming and cooling cycle using the tools we have now. The Solar people are somewhat bemused by what the sun might do next. I wouldn’t be surprised if the next solar cycle is an eye opener but maybe there are even more unusual things our sun can do over a period of 120,000 years? Perhaps a loopy jet stream is a precursor to much more unusual things?
By the way, the graph looks to be a mirror image! … Ok, back to reading 😉
I just realized that it is a mirror image on purpose – to show the time going forwards (to the right). … You could delete these 2 comments!
Well, maybe this is an idea. When temperature rises, CO2 is liberated from the ocean in all of its volume, but when temperature falls, CO2 is absorbed but only through the interface, that is at the ocean surface, so it takes longer to return to the water.