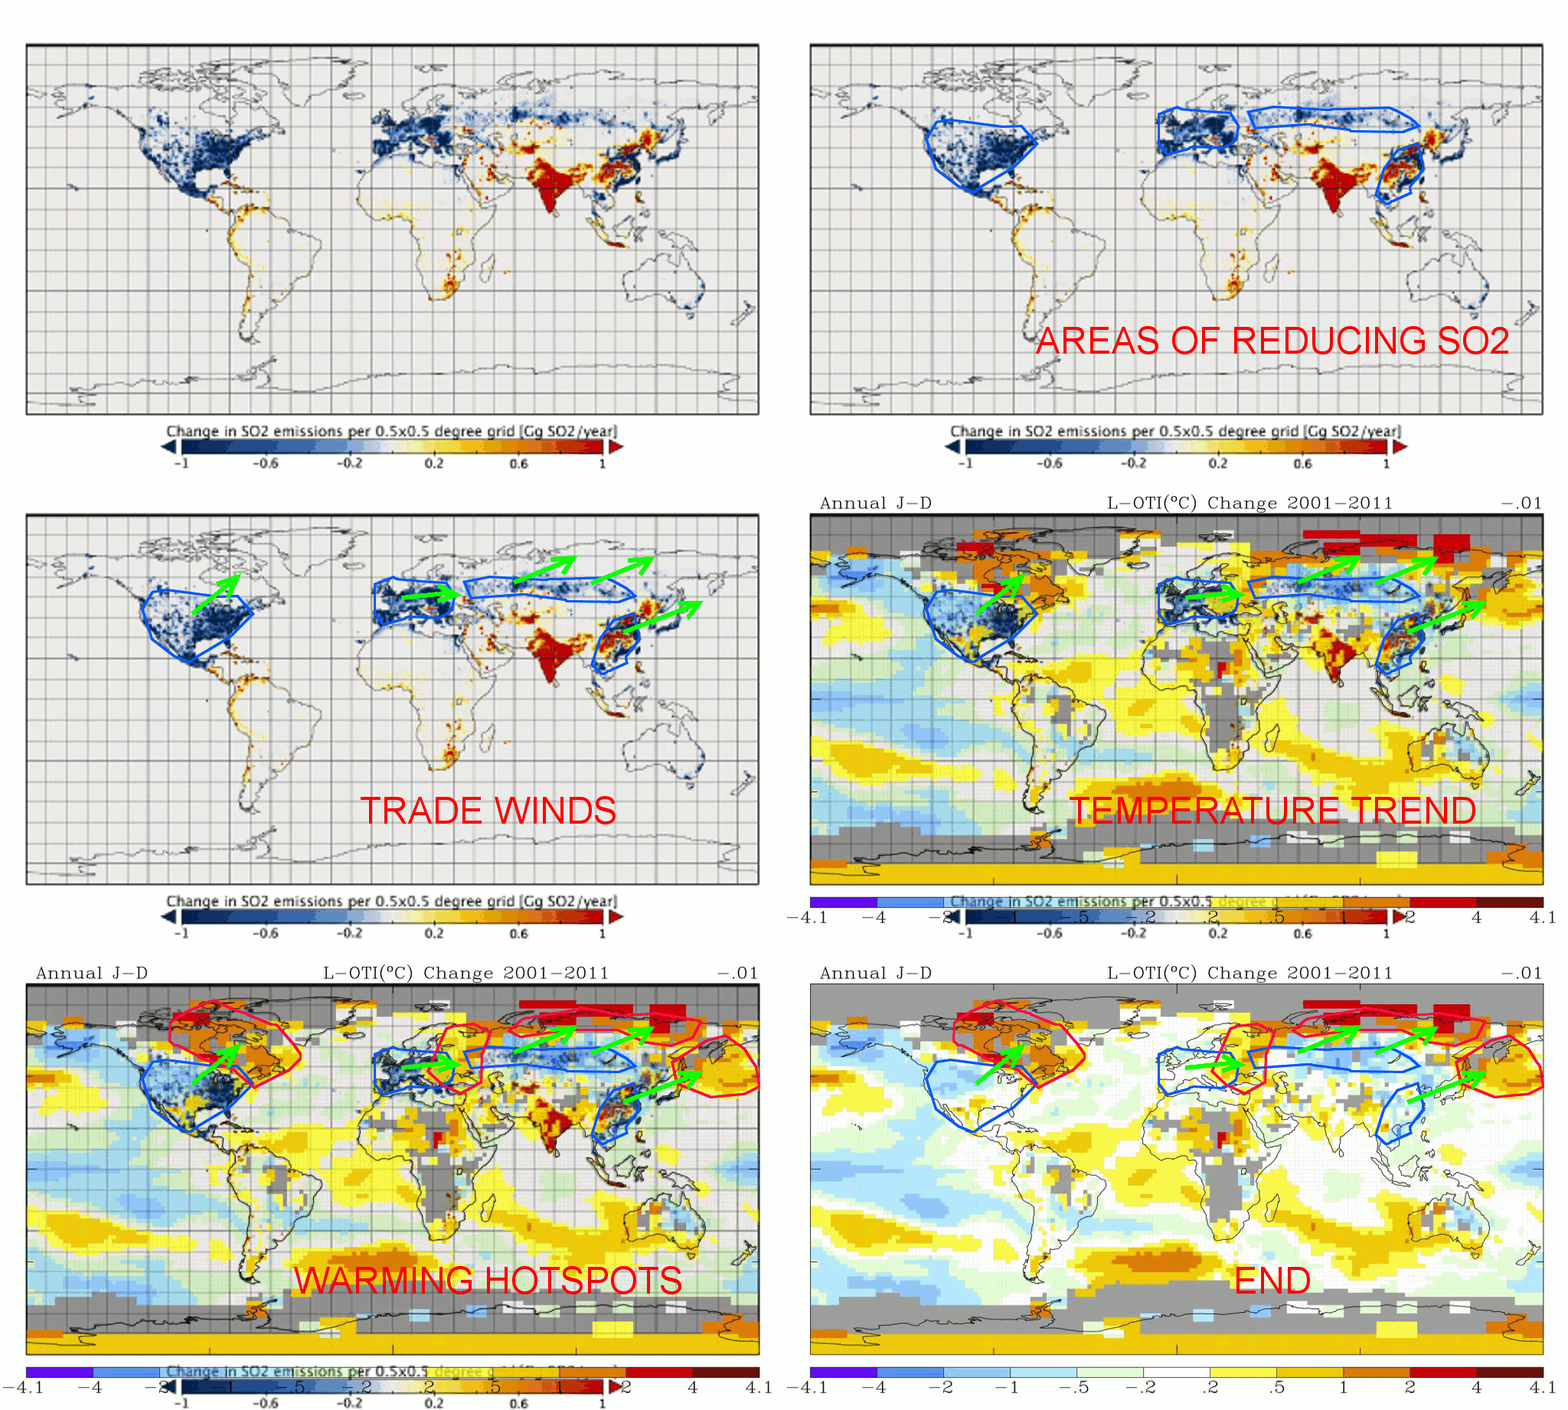
I’ve put together this map to show how the areas with reducing SO2 emissions in the period 2001-11 (blue) are linked by the trade winds with warming hotspots as shown by the 2001-11 GISS map. This shows that virtually the entire northern hemisphere’s climate change can be attributed to the location of areas that has their SO2 emission reduced. This strongly links warming in this area to reductions in SO2.
Note however that India and China have been increasing SO2 emissions. (Red) which are not obviously linked to cooling. This suggests that the warming was caused by some old technology that was taken out of service causing the warming and that new technology no longer has the effect.
 The above map links together:
- Change in regional distribution of anthropogenic land based SO2 emissions. Changes indicated as a difference between 2010 and 2005 emissions in 0.5° × 0.5° grids. http://iopscience.iop.org/article/10.1088/1748-9326/8/1/014003
- Trade wind directions
- The GISS map of annual (January to December) temperature trend (change) from 2001 to 2011. The –0.01 in the top right corner is the global trend figure, 0.01°C cooling. Source.


I do think that smog reduction in the autumn and winter had an effect. You only have to drive in and out of a fog bank to know what a huge effect on temperature at ground level it has. Since higher lattitude, towns from the West feature so heavily in the early years of global series, the pollution is a likely factor in depressing the cold month temperatures as measured of those years.
nb if the climate is too warm or temperatures have climbed too high, it isn’t necessarily cold enough for fog to form. And/or Smog in summer may suppress heat from cities dissipating into the night air.
It’s features like this that ould need each location to be examined to be able to ‘correct’ past, flawed readings. Two stations a few miles apart may read very differently because of location.
In the same way smog formed at the ground, a similar process must have occurred when air, filled with pollution around which droplets liked to form then reached the cloud layer.
So a London smog didn’t just affect London – the same air would rise up and form “smog” at the cloud layer and block out sunlight down wind according to the prevailing wind direction.
So, I’m now starting to think that London Smog and similar pollution from other cities throughout Europe was responsible for the “Little ice-age” – then that pollution was shipped out across the world until suddenly in the 1970s environmentalists forced us to stop releasing cloud-smog producing pollution and hey presto – without that cooling pollution – the world suddenly warms.
By that time of course, the green movement was more of a self-feeding monster needing another scare … and the rest is history.
Pingback: The biggest global experiment disproving CO2 as the main cause of late 20th century warming | Scottish Sceptic