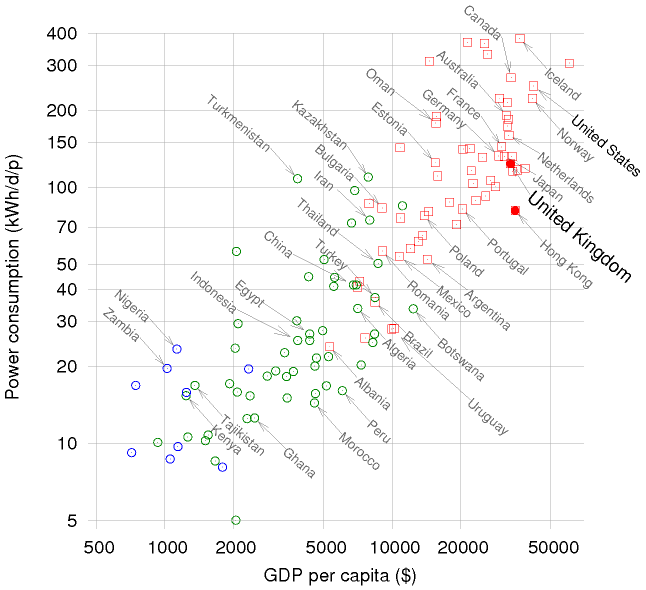
It’s a while since I originally wrote my first article “Enerconics: The Relationship between Energy and GDP” in which I presented evidence showing that GDP was closely related to energy usage both in terms of differences between global economies and also historically. A typical diagram is as follows:
This shows a very clear relationship which in 2007 was $0.45 of GDP per KWH of energy. In 2007 the average cost per KWH was about $0.09.
In the past I just used a hand waving argument that there was a a linear relationship to imply that energy could be used as a measure of economic activity in the same way as money. And to back this up I showed a graph similar to these:
 The first is based on “Carbon footprint” so is immediately suspect. The second, shows that raw material costing $1000/kg requires 1×10¹⁰ Joule/kg of energy. That is $0.36/KWH. That there is a linear relationship is undeniable, but value divided by energy is more expensive than the raw energy.
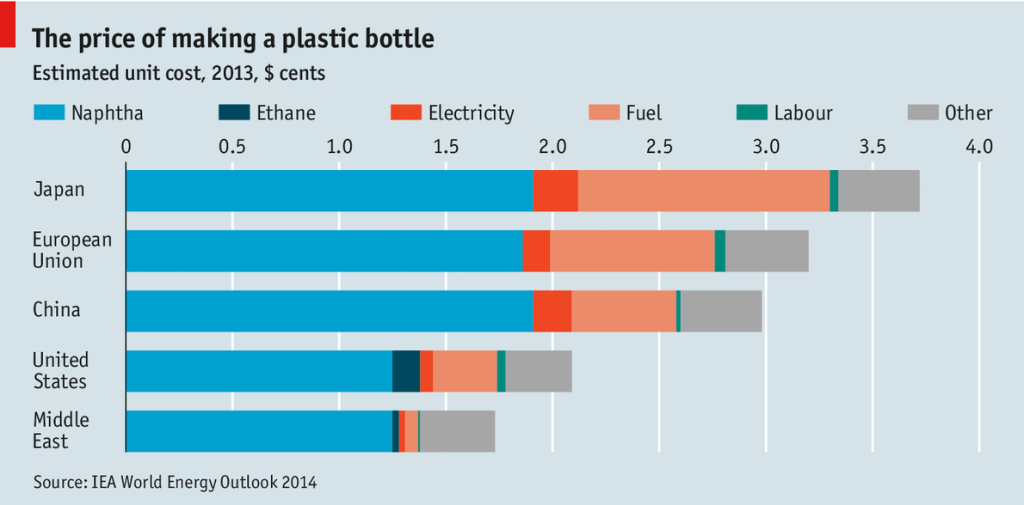
To help us understand this let’s take a simple plastic bottle:
The first thing to notice here is that whilst the direct cost of fuel is relatively low, the largest cost, the material of the bottle itself is an oil based hydrocarbon, which although not being used as a fuel here, could, and when incinerated is, used as a fuel. And if we count the material Naphtha as derived from “fossil-fuel” then fuels in some form or other are the overwhelming bulk of the cost.
But why the discrepancy in prices? The text explains it well:
The main type of plastic used, polyethylene terephthalate (PET), is made from naphtha, an oil derivative, which can be partly substituted with ethane, a natural-gas derivative. Very little ethane is traded internationally, so only places where natural gas is cheap and abundant use it to make PET. Because of its shale-gas boom, these now include America as well as the Middle East. Europe and Asia rely only on expensive naphtha. In these places the higher cost of fuel and electricity also push up production costs for plastic bottles. (link)
The problem is that this graph does not include the real energy but instead the cost of energy. And so the extra cost in places like Japan represents the cost of energy in transporting fossil fuels around the world. And by inference, if we did split out the costs according to the various types of energy sources, we should find that the comparable costs (excluding transportation and other social costs) are very much the same.
The Multiplier Effect
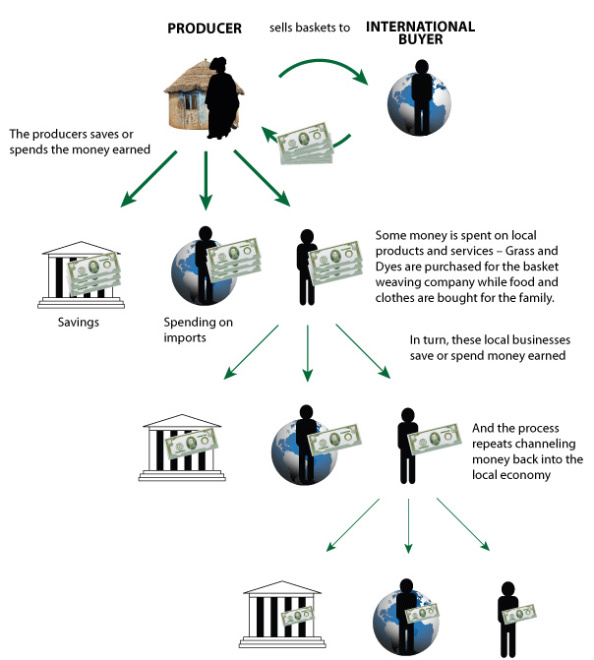
However, a more serious problem for this analysis is double counting. We all know the feel of new money and that of old. This shows the simple fact that unlike resources we consume once, money gets reused time and time again. Thus there is what economists term a “multiplier effect” when money is spent as shown below:
When we as a household buy goods, we purchase them from a shop. That money is then their income and they too will purchase goods from other people … including manufacturers. Who in turn will pay wages to people who will also buy goods from shops. Thus the same money becomes the wages of our initial person, part of the wages of the shops they buy from, that money in turn eventually becomes wages for people in factories and then in turn that becomes wages for mines and farmers.
In contrast, energy is used one and consumed. However, when we use money as an economic unit, we must treat it like money and assign value to the “stored energy” within goods and services. Thus although we consume $0.10 worth of electricity for each KWh used in producing raw materials, that energy is “stored” in the product as value and reused multiple times. And thus we can estimate how much stored energy is reused (n) in the economy by the economic value per KWH (~$0.45) divided by the cost of each KWH:
n = (GDP per capita) / (Cost per KWh * KWh per capita)
This figure is about 4. Which means the general relationship in modern societies for the economic value of energy is that:
GDP ~= n * Cost per KWh * Total KWh
(where n is ~4)
Cost of production
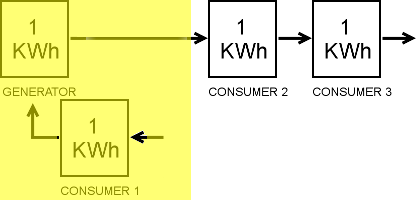
To understand the relative cost of energy below is a simplified diagram of our economy. Here there are primary generators who for each 1KWh of energy produce, that energy is transferred through the economy as “stored energy” within products and services so that the stored energy is used 4x within the economy.
 If we assume a cost per KWh of £0.10 then there is £0.40 of economic activity created for each KWH produced. But what happens if start using an energy source that has an additional cost of £0.10? This would be equivalent to the shaded area on the following where the generator and consumer 1 are combined:
 The output is still 1 KWH, but the economic cost is the original £0.10 to produce the energy, plus there is an additional £0.10 of energy costs in the production of each KWH. A more accurate way to draw this would be as follows:
 Now consumer one is not so much using the energy from the supplier, instead they are using “market energy” to feed into the generator in order to allow them to generate. The cost is now the original £0.10 for the generator plus the £0.10 used because this energy source requires additional work. But note here how the work going in (1KWh) is exactly matched by the energy coming out (1KWh). In other words, to produce this energy we need to input as much energy into the producer as the producer supplies eventually to the market.
This may sound absurd, but we do things like this all the time. We all have energy producing devices that consume more energy than they produce: they are called batteries. The reason we have them, is because the energy they supply has a utility greater than mains supply so we are prepared to pay much more for portable energy. But this shows that simply because energy comes out of a system, it doesn’t mean the system is a net producer. And from the above simple analysis it appears that when the cost of energy approaches twice the price of other forms of energy, there is a strong likelihood that more energy is going in than coming out.
Oil Equivalent of wind
One litre of fuel oil provides 11KWh of energy. The cost of fuel oil is about £0.35/litre or £0.032/kwh The current renewable obligation buyout price (the cost they get in addition to normal electricity prices) for wind is 0.045/KWh. It therefore follows that wind needs more subsidy money per KWh than it would cost to get the energy from fuel oil. Based on the above analysis it is quite likely that no windmill produces more energy out than the total energy costs involved in producing, transporting, the grid infrastructure, the backup generators, the cost of employing people in all the stages of production and the energy they use. When you add them all up – we’d have more energy as a society – and therefore produce less CO2 than if we did not have windmills. That’s what this analysis suggests.
Solar
Now lets compare that with solar which costs about 0.14/KWh. That is 4.4x the cost of hydro at £0.032/KWh. Straight away this massively high cost, tells us that solar is a net consumer of energy. In other words, for each KWH produced by solar, there is more energy going into making it and transporting it than is ever produced.


Pingback: The Enerconic or society energy multiplier | Scottish Sceptic
Pingback: Sceptical of sceptics? | Scottish Sceptic
Pingback: Scottish Sceptic