So far we have discussed ice-age cycles as if there is one and only one type of cycle of around 100k years. In this article I want to put flesh onto that skeleton and look at the variety of cycles and non-cycles that can be found.
See also:
- Introduction
- Criteria for Cycles
- Global warming and earthquakes
- Thermal crust expansion, decomposition and the Carbon cycle
- Overview of feedbacks
- Climate stability
- Hitting the buffers
- How CO2 could control climate
- Drying of climate
Benthic
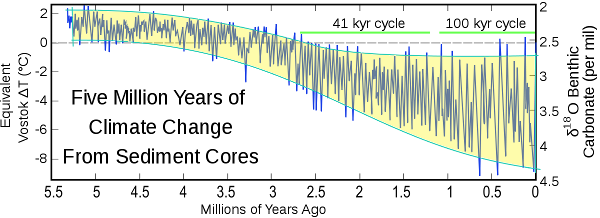
Like the ice-core estimates of ancient temperatures, the ratio of Oxygen 16/18 in Benthic provides another way to estimate temperature, but over a much longer period and below is a typical result:-
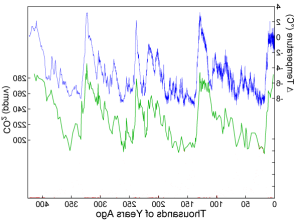
The first thing to notice is that this is a considerably longer period than the Vostok ice-cores shown to right. Whereas the Vostok icecored provide just over 400,000 years of climate data, the Benthic provides nearly 5.5million of data. And whereas the Vostok ice-cores shows four and a bit cycles, the Benthic core shows something like 50 identifiable peaks and troughs.
But these peaks and troughs are clearly not all the same. As shown in Fig 10.1, over the last million years the cycles have been of the order of 100,000 years in length. But over the preceding 1.5millioin years the cycles were smaller and shorter.
However, just as important as individual cycles is the overall trend shown below in figure 10.3
Over the last 5million years, the earth’s climate (at least in this proxy) has become considerably cooler by around 6C. However, although cooling appears over much of the 5million years, for the first 2million years of this record where no clear cycles were seen, the climate variation was fairly consistently around 2C.
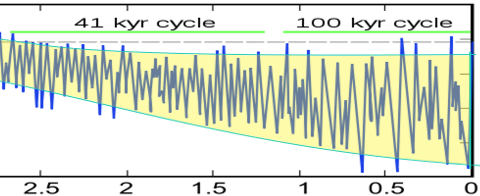
However, when the maximum temperature dropped below the “0C” figure shown on the left hand scale “Vostok equivalent Δt”, the climate appears to start behaving in a cyclic manner. Looking just at this portion in figure 10.4
we see that as the cooling of the average continued, the variation between maximum and minimum temperature appears to have increased in such a manner that the maximum temperature is almost constant whilst it is the minimum temperature during the cycles that decreases.
As stated previously in Hitting the buffers this constancy of maximum strongly suggest that there is some kind of threshold at this upper limit where either negative feedbacks start to come in which limits the climate’s ability to warm or that positive feedbacks disappear.
However, whilst a threshold must exist in some form, it is also true to say that before the cyclic behaviour, the global temperature regularly crossed this threshold. So this threshold, whilst clearly marking a point where negative feedbacks come into play, these negative feedbacks do not fundamentally stop the climate getting warmer. Indeed, the threshold is not apparent before the cyclic behaviour so it looks very much as if they are linked.
Getting down the to the nitty gritty
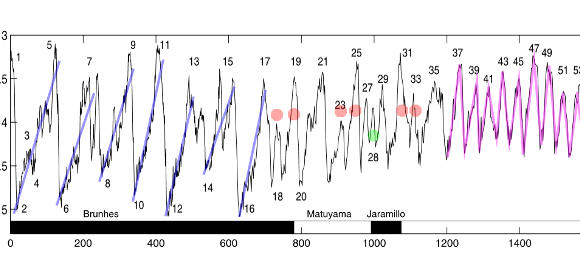
Fortunately, I was able to find a very detailed plot of this Benthic from a paper by Lorraine E. Lisiecki and Maureen Raymo. From this we are able to examine the details of the various cycles over many millions of years. Let’s start with the most recent cycles (fig 10.5) which I have marked to highlight features (note this is reversed compared to my other traces with the present day to the left).
Recent Sawtooth Period (0-~700kBP)
Here we can readily see the characteristic sawtooth pattern throughout the last 700,0oo years. There are six sharp inclines over 613k years indicating a cycle period of around 102k years. Working from right to left, the cycles clearly follow a pattern of a sharp rise in temperature followed by a much longer overall fall. But we can also see that this is not as regular as the label suggesting a 100,000 ice-age cycle. Whilst the last four peaks (0-420k: 5,7,9,11) are fairly regular and readily identified as a single sharp rise followed by a overall decline, the peak(s) between 420-630k (13,15) are not so regular. Indeed it is hard to decide whether we have one peak (15) followed by a decline with a large variation or whether we have two peaks where the second (13) neither starts from such a low temperature as the rest nor reaches such a high one.
This smaller deviation when the temperature has not reached the “normal” low value (together with the variation in the minimum) is symptomatic of a form of triggered oscillation in which some quantity is slowly built up over time and then released by some trigger. It would fit the trace if peak 13 were a “prematurely” triggered release of some quantity that did not have time to reach the same level as other cycles.
Indeed, if we look closely we also see peak 7 and 9 whilst less obvious, have a similar “prematurely triggered” look about them resulting again in a smaller maximum for peak 7.
Chaotic peaks (700k – 1.2m BP)
However, if we look further back than 700k years before present, we see that the patter of variation is now far more chaotic. Here we have two new types of features:
- Double peaks (dotted green)
- Multiple peaks (dotted pink)
Indeed, during this period, there are only two peaks that even vaguely look like the later sawtooth cycles that the climate has been experiencing and these are 21 and 35. However, note how if we count all the double and triple peaks as single peaks, we have five groups within 500,000 years suggesting that there is still some element of the 100,000 year cycle present.
Regular shorter peak (1.2m – 1.5m)
Then as we look even further back in time before 1.5m years we see another very regular pattern of ice-age cycles, but this time with 9 cycles in 375k years. This is an average of 42k years. However, rather than appearing as a sawtooth with a sharp rises in temperature followed by a more gradual decline, in this period, the temperature seems to cycle as a triangular wave with similar rates of increase and decrease “/\/\/\/\”.
Conclusion – rapid rates of rise increase with the amplitude and duration
One thing that is already obvious is that the sharp rises characteristic of the recent sawtooth cycles only appears after the temperature has dropped very low beforehand. Or to turn that around, the sawtooth cycles appear to be caused in some way by the minimum temperature (or because each cycle has a similar cooling slope) by the time the globe cools before the sharp upturn in temperature.
Postulate: that the length and depth of cooling increases the contraction of the earth’s crust thereby giving “more room” for expansion when the temperature rises. And that if this cooling is curtailed by early “triggering”, that there is “less room” for expansion and that as the expansion of the earth appears in some way to cause the warming, that the extent of warming is controlled by the level
Triangles and intervals 1.2m-2.7m BP
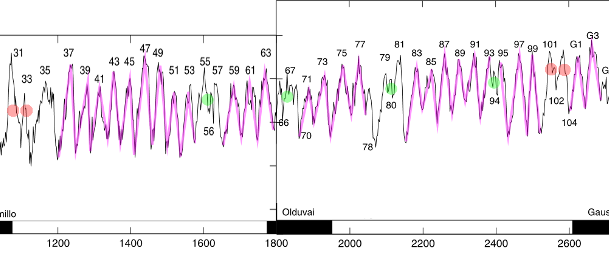
I’ve already mentioned the “triangular” pattern of cycles that was found before 1.2m BP. But looking at figure 10.6 where I have marked the clearly triangular waveforms, we see that this pattern lasted for some 1.5million years, except for a few oddities (marked green for multiple peak and pink for doubles). These oddities occurred quite evenly.
Taking peak 35 as the beginning,they occur after:
| Peak | Time from first peak (35) | Fractions of 314k cycle |
| 35 | 0 | 0 |
| 55 | 450 | 1.4 x 314k |
| 67 | 660 | 2.1 x 314k |
| 80 | 950 | 3.0 x 314k |
| 94 | 1230 | 3.9 x 314k |
| 102 | 1410 | 4.5 x 314k |
There is clearly a very regular pattern to these multiple peak interludes for peaks 67,80 & 94 with each being close to an exact multiple of 314k years after the first peak. Moreover, the other two irregular peaks (55 & 102) are are close to 0.5 more and less than their neighbours.
This strongly suggests an underlying pattern overlying the ice-age cycle of around 157k or 314k years. Alternatively it could be some form of beat frequency:
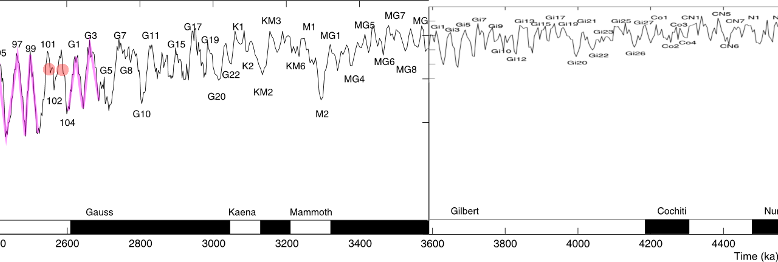
Noise 2.7m+ BP
Finally when we look far enough back beyond 2.7m years, we see that the waveform essentially contains few recognisable sequences indicative of cycles.
Full sequence below:-
See also:




Three things happened that I think initiated the current cycle of ice ages.
Antarctica ended up centered on the South Pole
Panama closed up
The Aleutian island chain was formed. This last one may be key to prolonging the ice ages and their sudden termination. When ice ties up ocean water, sea level falls to the point that the Bering straits can get clogged with ice and more or less closed to ocean circulation. Then the arctic ocean stays cold all year and the ice age is prolonged. In reverse the ice dam can suddenly break and the arctic ocean suddenly starts getting pacific water.
I was hoping you were going to say something around 65N. The reason is that somehow the climate seems to be particularly sensitive to insolation at 65N so that it has a global impact far greater than the small impact it has just in this region.
However … if we are talking about the 5million years we’ve been getting colder … you know what! I’ve entirely forgotten to try to explain the overall cooling and how this relates to what I’ve presented.
The clogging of ice does seem to be a major factor. I have been looking at the peak temperature in tropical SST. Herbert et al. 2010 has a roughly 3.5 million year reconstruction using Uk’37 which appears to have a cool bias. Comparing their reconstruction to Mg/Ca reconstructions that overlap I have a rough tropical “peak” summer temperature reconstruction.
http://redneckphysics.blogspot.com/2015/02/my-tropical-ocean-summer-or-peak.html
The energy required to form the glaciers to begin with tends to get over looked. If it takes longer to build glaciers that would change the cycle frequency.
Dallas, Craig tomorrow at noon, I’m going to be proposing another major idea which is that the ocean and current system might exist in several stable states and that we could swap between them.
After initially being enthusiastic, then working out that the Coriolis force seemed to rule this out, then working out that by my own logic, the present system was not possible and therefore surface resistance must in some way be allowing the present system, so could possibly allow my proposed switch … I’m not sure.
What is of greatest interest is, why the Ice Ages all end very suddenly and spectacularly with the warmest weather and then degrades to cooler weather over time.
The suddenness of the warming can have only one source: the sun.
Already commented on the crustal idea. I think it can be rejected as false concerning ice age periodicy.
But there is a quite credible theory that plate tectonics did in fact start the Pleistocene era, by closing the Panama Isthmus at that time and forcing an entirely new pattern of ocean circulation. Of course, correlation is not causation. But ocean currents and oscillations are the major redistributors of heat from the tropics polewards, not the atmosphere. And it is absence of summer heat to melt accumulating snow that starts an ice age amplified by the growing albedo feedback of the icecaps.
So how do you explain the change in crustal thickness in correlation with the ice-age cycles at the mid-oceanic ridge?
Pingback: Toward a new theory of ice-ages XIII (How cycles are triggered + upper threshold) | Scottish Sceptic