This article explores how changes in CO2 might be linked through plant growth to global water vapour and thus provide a potential indirect mechanism by which CO2 might influence climate.
To recap
So far I have introduced the concept of climate cycles and how positive feedbacks must be present in order to have the ice-age cycles. I have also shown that in interglacial periods either additional negative feedbacks come into play or the positive feedbacks disappear so that further warming is very hard.
In Global warming and earthquakes I introduced a mechanism with a delay sufficiently long to provide the timing mechanism creating the roughly 100,000 year ice-age cycle we see at present. In that article I suggested CO2 was released in great quantity, but I did not provide any means by which that could influence climate except the very small greenhouse effect of CO2.
See also:
- Introduction
- Criteria for Cycles
- Global warming and earthquakes
- Thermal crust expansion, decomposition and the Carbon cycle
- Overview of feedbacks
- Climate stability
- Hitting the buffers
CO2 and water vapour feedback
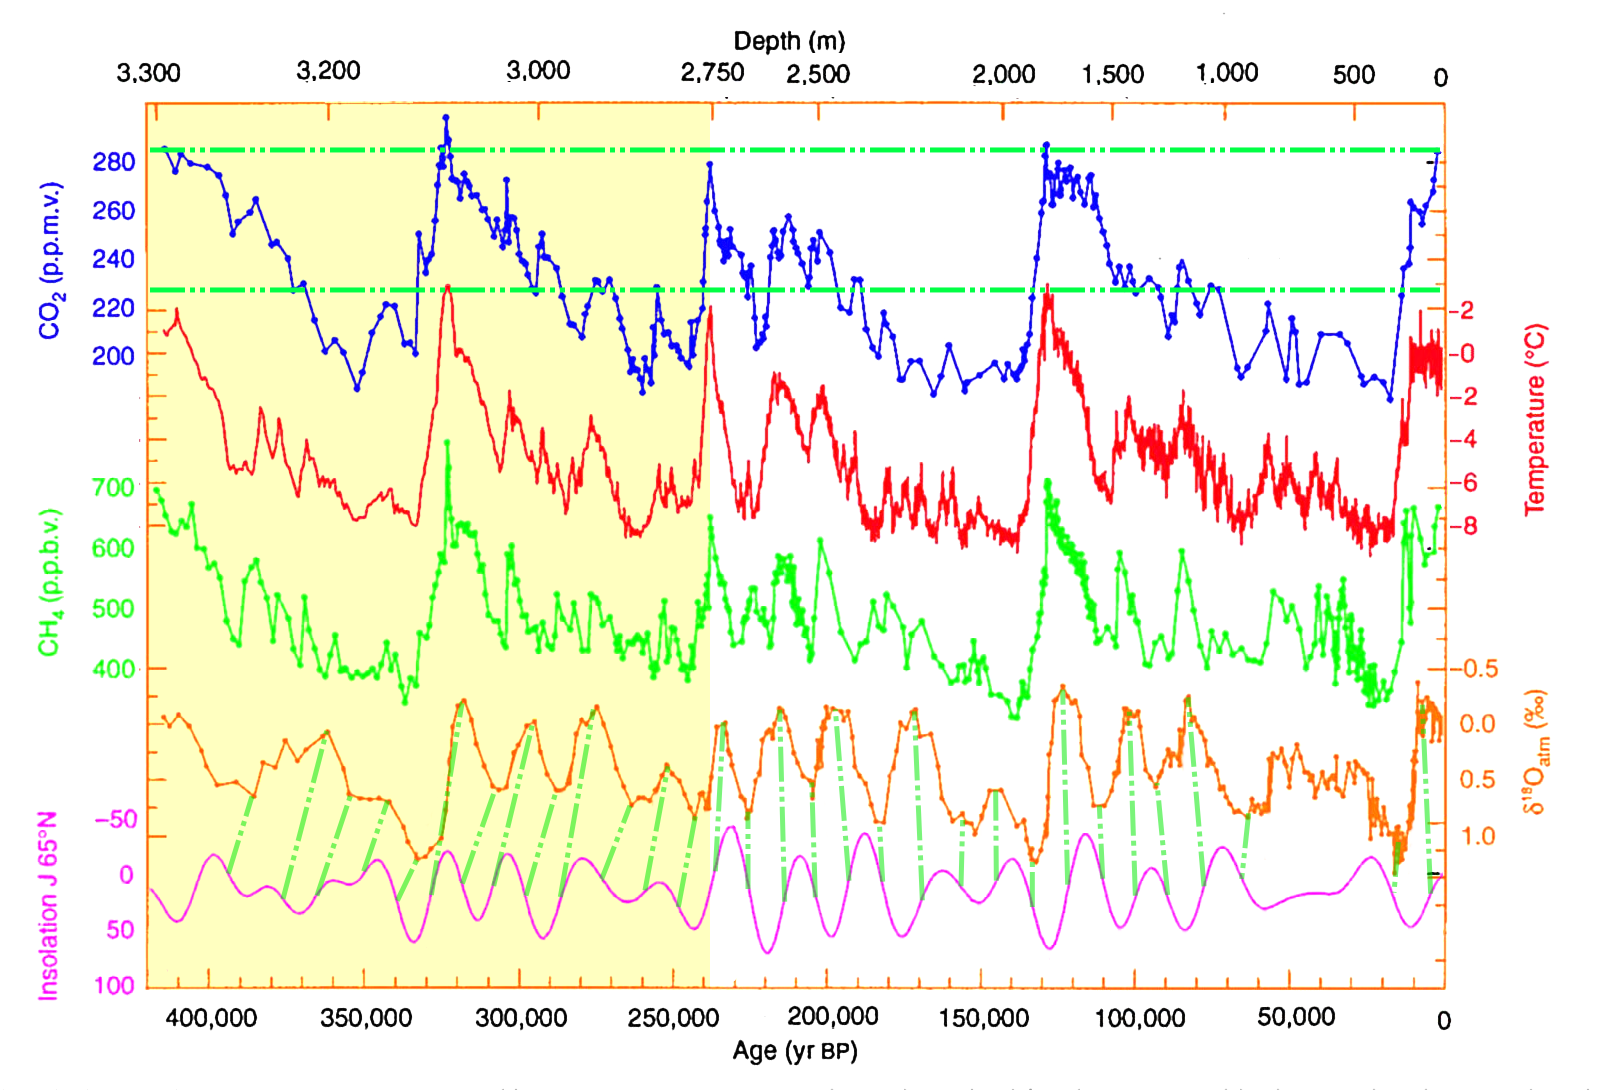
Fig. 8.1 Vostok ice core showing various proxies for climate over last 420,000: CO2 (blue), proxy temperature (red), CH4 (green), δO18 ( brown), Solar Insolation (Inverted mauve).
Relationship of ice-core to solar insolation is shown by dash green lines which show a sharp change at 238,000 years BP
Looking back at the ice core data, we can see that the general pattern is that of a sharp rise in both temperature, CO2 and methane rising to the same peak and then a steady decline.
This relationship is in fact the single strongest evidence of “positive feedbacks” in the climate system because for a rise of a around 80ppm, the temperature rises around 8C, suggesting (but not proving) that even a very small rise in CO2 can have a very profound influence on temperature.
To put this in perspective, if the change from 200 to 280 ppm (140%) is a true reflection of the scale of change, then the climate sensitivity this implies is around 16C per doubling of CO2. If that feedback were in effect at this time, it would imply the rise from 340ppm CO2 in 1958 to 400ppm today should cause around 2C warming.
Various mechanisms have been proposed to explain this “positive feedback” , such as an increase in albedo as darker soils are exposed by receding ice, however none are sufficiently large. (see Overview of feedbacks)
But CO2 is a relatively poor greenhouse. In contrast water vapour is far more potent.
Water vapour the greenhouse gas of choice
We know that during the ice-age the climate was not only colder but drier than at present. I would therefore like to suggest that as we entered an ice-age that not only did CO2 levels decrease but also water vapour in the atmosphere.
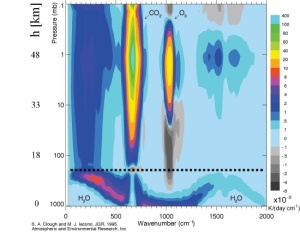
Fig 8.2 (above) is a plot of spectral IR interaction showing the various IR interactive gases (AKA greenhouse gases). Here we can see the distinctive CO2 band at 670nm from around 10km up. (The left hand yellow area) However, whilst the temperature drop is significant (2C @100mb, 20C @10mb and 100-400C @1mb) the effect is across a rather narrow band high in the atmosphere and therefore at low pressure and so low density. In contrast the band for H20 might be lower at 6C @1000mb but it is very broadband and its affect is low down in the atmospher where the density of gases is higher.
So, water vapour, whilst only present in enough volumes to be active in the lower 10km has far more impact on the global temperature than CO2.
But if CO2 controlled the emission of H2O by some means, CO2 could have a massive impact on climate through the action of CO2. In effect, whilst the greenhouse effect of CO2 is low, the impact could be large if it controlled water vapour in some way.
Proposed mechanism
I will now propose a very simple mechanism that could lead to massive feedbacks.
The key to this proposal is a very simple fact:
 There is clear evidence that changing vegetation at a local level leads to the localised heating which in its extreme form is called “Urban heating” (September 14 2011 in Environmental Research Letters see Water evaporated from trees cools global climate) however there is also evidence that in a wetter period with cloud formation such as now, that cutting down forests can lead to global cooling: (see: Study: Conversion Of Forests to Cropland Cooled the Climate). So, it is already known that vegetative cover has a large influence on the climate both locally and globally.
Present CO2 levels in a geological perspective
It’s a simple fact that is often ignored in debates on the climate that even at todays elevated levels of CO2 compared to earlier this century, we still live at a time of unprecedented CO2 depleted compared to the last few hundred million years:
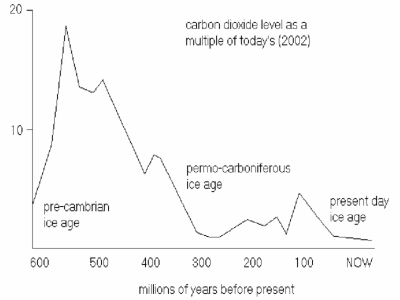
Fig 8.3. Source
A CO2 desert
Whilst evolution has no doubt selected plants that can cope with the present very low levels of CO2, there’s no doubt that plants appreciate more CO2 and therefore CO2 is as important as other factors such as sunlight and water in determining plant growth.
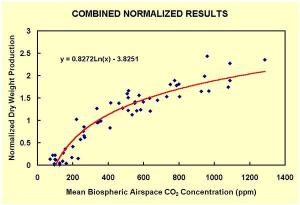
Fig 8.4 source
An obvious mechanism by which CO2 could impact plants is shown by the plot of plant growth and CO2 in fig 8.4.
As can be seen below, the growth rate of plants (in this case common Devil’s Ivy or Golden Pothos (Scindapsus aureus)) varies significantly with CO2. There is around a 50% increase in growth rate when CO2 is doubled from 400ppm to 800ppm, but this is nothing compared to the halving of growth rate from 400ppm to 200ppm and the absence of any growth below 100ppm. And note how much the slope drops down below 200ppm and that plants at 180ppm (the lowest level in the depths of the ice-age) age would be extremely stressed.
But how can plants affect the climate?
According to Trenberth et al (2009) an average of some 80w/m2 of heat is lost from the earth’s surface via evapo-transporation. This compares to a net loss of (80+17+396-333 =) 160w/m2. In comparison, the total effect from a 40% increase in CO2 during the ice-age cycle is around 2w/m2.
How much of this 80w/m2
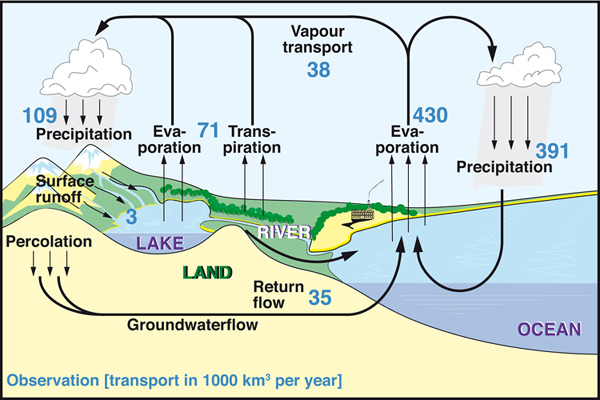
comes from plants? The oceans cover around 70% of the earth’s surface but according to Lennart Bengtsson (2010) 71km3 out of the total 504km3 of water from the earth’s surface comes from plants.
That means 14% of all water lost from the surface of the earth comes from land based. If plants are stressed by lack of CO2 and they will tend to grow only in ideal conditions, because in order to absorb CO2, plants need to allow gases from the atmosphere to exchange between the air and the water in their leaves. But water being a lighter molecule than CO2 will more freely evaporate from leaves than CO2 will enter them. So, if there is less CO2, plants will need a greater surface area of leaves to absorb the same quantities of CO2. But as H20 will readily evaporate from any surface that will absorb CO2, then as CO2 levels decrease the rate of H20 evaporation for each quantity of CO2 increases. Thus as CO2 levels drop, plants can no longer tolerate such dry conditions and so there will be less plants and less transpiration.
However, as fig 8.5 shows, much of the water evaporated from plants comes back as rain. So, if plants are not transevaporating water and instead it flows out through rivers, there will be less rain and less rain means the land surface will become drier, conditions will become worse for plants and even less plants will be able to grow.
Land represents a relatively small proportion of the earth’s surface globally, but as fig 8.6 below shows, around 75% of the earth’s surface is land at at the approx 60° north latitude which appears to be where the Milankovitch cycles are most important.
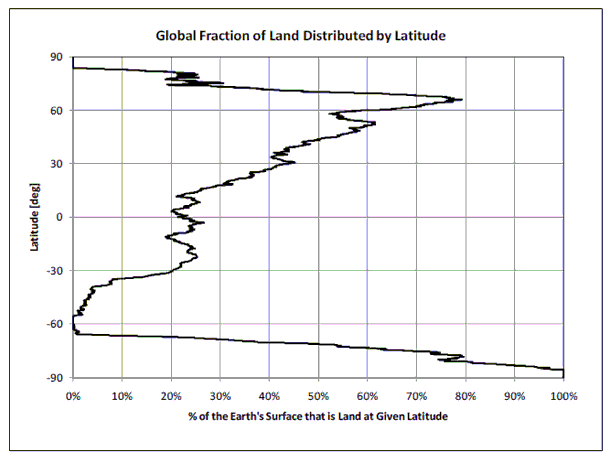
Fig 8.6. Source
So global reductions in CO2 could have a profound impact on plant life particularly around 60° North which in turn could dramatically reduce atmospheric water vapour.
As table 8.1 below shows, of all the greenhouse gases in the atmosphere that which contributes the most to
| Atmospheric constituent | Change when each removed (relative to all removed) |
| H2O | 36% |
| Clouds | 14% |
| CO2 | 12% |
| O3 | 3% |
Table 8.1
source Ramanathan and Coakley, Rev. Geophys and Space Phys., 16 465 (1978)
And if water vapour disappears from the climate, more areas will become desert, and this will add to the problems of decreasing CO2 because plants need to have greater surface area exposed to atmosphere to absorb the very small levels of CO2, and this in turn means they lose more water meaning that they are stressed unless in areas with plenty of water. So CO2 starved plants need more water just at a time a lack of plants is reducing atmospheric water vapour and making the climate drier.
So, this becomes a vicious cycle – CO2 starvation leads to loss of plants. Loss of plants lead to loss of water vapour from atmosphere. Loss of water vapour leads to cooler and drier climate, which leads to less plants. Moreover as areas of sea cool and turn to ice, so in turn there is a loss of water vapour from the sea.
And so reducing CO2 causes the earth to effectively turn into a “snowball”.
CO2 becoming locked up.
As we see today, with colder climate, we get peat bogs and permafrost. Along with geological process, these slowly lock up CO2 denying vital carbon to plants.
If however, there is an injection of carbon into the system, this injection leads to a rapid growth in plants, this growth of plants can lead to a rapid increase in water vapour, that in turn leads to global warming due to trapping heat and this in turn can unlock carbon deposits locked up in peat and permafrost. Thus a small rise in CO2 can trigger a massive rise in H20 this in turn can lead to a massive rise in temperature – with such a blooming of plants that for a time they depress CO2 until the injection rate of CO2 exceeds that for plants and the whole system goes into catastrophic warming.
The research on plant growth at low CO2
Temme, A.A., Cornwell, W.K., Cornelissen, J.H.C. and Aerts, R. 2013. Meta-analysis reveals profound responses of plant traits to glacial CO2 levels. Ecology and Evolution 3: 4525-4535.Background
The four Dutch researchers report that “on average across all species,” a 50% reduction in current atmospheric CO2 reduced net photosynthesis by 38%, intrinsic water use efficiency by 48% and total plant dry biomass by 47%.
Temme et al. conclude that in terms of carbon gain and whole-plant growth rate, responses to low CO2 are, in fact, somewhat more extreme than responses to high CO2, the latter of which gradually diminish in magnitude as the air’s CO2 concentration rises higher and higher.
Gerhart, L.M., Harris, J.M., Nippert, J.B., Sandquist, D.R. and Ward, J.K. 2012. Glacial trees from the La Brea tar pits show physiological constraints of low CO2. New Phytologist 194: 63-69.
Background
The authors write that “at the peak of the last glacial period, atmospheric CO2 concentrations ranged between 180 and 200 ppm, which are among the lowest concentrations that occurred during the evolution of land plants (Berner, 2006),” and they say that “when grown at glacial vs. modern CO2, modern C3 plants show 40-70% reductions in photosynthesis and biomass production (Polley et al., 1993; Sage and Coleman, 2001), 20-30% lower survival (Ward and Kelly, 2004), and may even fail to reproduce (Dippery et al., 1995).”
In describing the significance of their findings, the five researchers say that their study “provides some of the first direct evidence that glacial plants remained near their lower carbon limit until the beginning of the glacial-interglacial transition,” which lower limit appeared to them to be 90 ppm CO2, below which value it appeared that “juniper trees may not maintain a positive carbon budget for basic physiological functions for survival,” as is also suggested by the corroborative work of Campbell et al. (2005).
Gesch, R.W., Vu, J.C.V., Boote, K.J., Allen, L.H., Jr. and Bowes, G. 2000. Subambient growth CO2 leads to increased Rubisco small subunit gene expression in developing rice leaves. Journal of Plant Physiology 157: 235-238.
Rice (Oryza sativa) was grown in controlled environment chambers receiving atmospheric CO2 concentrations of 350 and 175 ppm to study the effects of subambient CO2 concentrations on photosynthesis in this agricultural species. Although both chambers were initially subjected to ambient CO2 concentrations, at 34 days after planting one of the chambers had its atmospheric CO2 concentration reduced to only 175 ppm, which was then maintained throughout the remaining ten days of the experiment.
One day after lowering the atmospheric CO2 concentration, plants exposed to 175 ppm CO2 displayed photosynthetic rates that were 45% less than those exhibited by control plants growing at the ambient CO2 concentration. Moreover, at day five of half-ambient CO2 exposure, the photosynthetic reduction become even more severe, reaching 52%. However, between days five and ten of half-ambient CO2 exposure, plants growing in this unfavorable treatment exhibited a 35% increase in their photosynthetic rates, but subsequent rates were still significantly lower than those observed in plants grown at 350 ppm CO2. This delayed photosynthetic enhancement was at least partly due to 24 and 19% increases in rubisco activity and content, respectively, within developing leaves. Thus, low CO2 concentrations induced an up-regulation of rubisco and photosynthetic rates in young leaves of rice.
Other references
Berner, R.A. 2006. GEOCARBSULF: a combined model for Phanerozoic atmospheric O2 and CO2. Geochimica et Cosmochimica Acta 70: 5653-5664.
Campbell, C.D., Sage, R.F., Kocacinar, F. and Way, D.A. 2005. Estimation of the whole-plant CO2-compensation point of tobacco (Nicotiana tabacum L.). Global Change Biology 11: 1956-1967.
Dippery, J.K., Tissue, D.T., Thomas, R.B. and Strain, B.R. 1995. Effects of low and elevated CO2 on C3 and C4 annuals. I. Growth and biomass allocation. Oecologia 101: 13-20.
Etheridge, D.M., Steele, L.P., Langenfelds, R.L., Francey, R.J., Barnola, J.-M. and Morgan, V.I. 1996. Natural and anthropogenic changes in atmospheric CO2 over the last 1,000 years from air in Antarctic ice and firn. Journal of Geophysical Research 101: 4115-4128.
Keeling, R.F., Piper, S.C., Bollenbacher, A.F. and Walker, J.S. 2009. Atmospheric CO2 records from sites in the SIO air sampling network. In: Trends: A Compendium of Data on Global Change. Carbon Dioxide Information Analysis Center, Oak Ridge National Laboratory, U.S. Department of Energy, Oak Ridge, Tennessee, USA.
Polley, H.W., Johnson, H.B., Marino, B.D. and Mayeux, H.S. 1993. Increase in C3 plant water-use efficiency and biomass over glacial to present CO2 concentrations. Nature 361: 61-64.
Sage, R.F. and Coleman, J.R. 2001. Effects of low atmospheric CO2 in plants: more than a thing of the past. Trends in Plant Science 6: 18-24.
Ward, J.K. and Kelly, J.K. 2004. Scaling up evolutionary responses to elevated CO2: Lessons from Arabidopsis. Ecology Letters 7: 427-440.
See also:
- Introduction
- Criteria for Cycles
- Global warming and earthquakes
- Thermal crust expansion, decomposition and the Carbon cycle
- Overview of feedbacks
- Climate stability
- Hitting the buffers


Pingback: Toward a new theory of ice-ages IX (Drying of climate) | Scottish Sceptic
Pingback: Toward a new theory of ice-ages X (5million years of cycles) | Scottish Sceptic
Evaporation surface is cooled during the day, but slows down the cooling in the night, which is very important for the plant. Water vapor reduces the temperature gradient Depending on the height above the surface?
You’ve lost me as I’m not sure how evaporation can slow down cooling.
What we know is that a huge percentage of the surface heat is lost through evaporative cooling and that plant growth actively increases evaporative cooling.
In a cloudless atmosphere (like the ice-ages?) this will increase the water vapour and so increase the greenhouse effect.
However, when there is enough water vapour in the atmosphere we see cloud formation (or more accurately more clouds). This has a massive influence on the climate and could theoretically increase the warming effect or reduce it. However, because the interglacial temperature is stable, it seems the predominant impact of a wetter climate as we see in the interglacial must in some way lead to strong negative feedback that stabilises the temperature. This strongly suggests that clouds are predominantly a form of negative feedback. (At least for warming – so further warming is very difficult).
When the air is saturated with water vapor (at its dew point), the moist adiabatic lapse rate (MALR) or saturated adiabatic lapse rate (SALR) applies. This lapse rate varies strongly with temperature. A typical value is around 5 C°/km (2.7 F°/1,000 ft) (1.5C°/1,000 ft).[citation needed]
The reason for the difference between the dry and moist adiabatic lapse rate values is that latent heat is released when water condenses, thus decreasing the rate of temperature drop as altitude increases. This heat release process is an important source of energy in the development of thunderstorms. An unsaturated parcel of air of given temperature, altitude and moisture content below that of the corresponding dewpoint cools at the dry adiabatic lapse rate as altitude increases until the dewpoint line for the given moisture content is intersected. As the water vapor then starts condensing the air parcel subsequently cools at the slower moist adiabatic lapse rate if the altitude increases further.
http://en.wikipedia.org/wiki/Lapse_rate
I’m just guessing but it sounds as if you are suggesting a change in overall water vapour levels would lead to a change in the average adiabatic cooling rate.
So, a reduction in water vapour would tend to increase the adiabatic cooling rate leading to lower temperatures and therefore a reduction in IR emissions and hence increased surface temperature. (although the emission would be from lower down which would tend to offset this)
In contrast, higher water vapour levels result in more of the atmosphere with a 5C/km rate and so warmer levels at higher altitude. But again, the higher opacity due to increased water vapour would on average make these emissions come from a higher and therefore (at least in troposphere) a lower temperature.
However, with such massive changes, who can say the atmospheric temperature profile would stay the same?
Clearly plant photosynthesis is part of the carbon cycle. And clearly land plants (the preponderance in the NH) are important. Evidence is in the annual rhythm of the Keeling curve.
Equally clearly, more CO2 benefits plants, especially the 85% of species that use the C3 pathway. C4 plants are less benefitted. See essay Carbon Pollution in my newest book.
But I don’t think evapotranspiration is a major factor in atmospheric water vapor. There is a line of reasoning, and there is direct evidence. The line of reasoning is that oceans are 71% of Earths surface. And, satellite imaging shows that more than 71% of precipitation falls over the oceans, not over land. Details in my first book. The direct evidence is that surface level relative humidity is relatively constant over all oceans, but decreases over land. If plant transpiration were a major contributor to atmospheric water vapor, this would not be true.
There’s something odd with the climate that makes it particularly sensitive around 65N which is where the Milankovitch cycles are strongest. This suggests that changes at 65N in effect control the whole climate.
And whilst I agree that land surface is a small fraction of the earth’s surface, it is the dominant surface at around 65N.
What I’ve suggested is that because around 65N we see the upwelling of the Hadleigh cell with both Polar and Saharan air flows – both of which need added heat and/or moisture in order to help the air rise, heat entering the system at 65N where land mass dominates, may in some way modulate the Hadleigh cell strength so that a relatively small change in heat at 65N has major effects globally.
And there is the change in dust in the ice-cores which does seem to indicate a change in wind direction and/or drying. And the chaotic nature of the weather systems around the UK are the type of thing one expects to see in a system with very large positive feedbacks. In other words, small amounts of natural variation appear to be massively magnified.
Temperature reflects the average randomized kinetic energy of constituent particles of matter (e.g. atoms or molecules) relative to the centre of mass of the system, while heat is the transfer of energy across a system boundary into the body other than by work or matter transfer. Translation, rotation, and a combination of the two types of energy in vibration (kinetic and potential) of atoms represent the degrees of freedom of motion which classically contribute to the heat capacity of matter, but loosely bound electrons may also participate. On a microscopic scale, each system particle absorbs thermal energy among the few degrees of freedom available to it, and at sufficient temperatures, this process contributes to the specific heat capacity that classically approaches a value per mole of particles that is set by the Dulong-Petit law. This limit, which is about 25 joules per kelvin for each mole of atoms, is achieved by many solid substances at room temperature.
For quantum mechanical reasons, at any given temperature, some of these degrees of freedom may be unavailable, or only partially available, to store thermal energy. In such cases, the specific heat capacity is a fraction of the maximum. As the temperature approaches absolute zero, the specific heat capacity of a system also approaches zero, due to loss of available degrees of freedom. Quantum theory can be used to quantitatively predict the specific heat capacity of simple systems.
http://en.wikipedia.org/wiki/Heat_capacity
Water vapor has a large heat capacity.
Of course, the clouds cools surface (albedo).
Pingback: Toward a new theory of ice-ages XI (Hadley Cells) | Scottish Sceptic
Figure 8.6 is, as the source comments, cool. That is it has a clear pattern. It is the pattern of distribution caused by a tetrahedron.
Pingback: A complete explanation of the ice-age cycle. | Scottish Sceptic