
If you are still one of the people who believe the “Greenhouse theory” of warming, but don’t quite know why it sounds rubbish. Let me recap the advanced theory & the differences (CO2 used to mean all greenhouse gases including H2O).
- The greenhouse theory says CO2 absorbs IR – the advanced theory says it absorbs and emits IR
- The Greenhouse theory says that the greenhouse effect is strongest at the bottom of the atmosphere under the blanket of the atmosphere (BS). The advanced theory says the effect of CO2 has most effect at the top.
- The Greenhouse theory says the atmosphere doesn’t have any lapse rate through the atmosphere. The advanced theory says that as we rise up, the reduction in energy of the gas results in a loss of energy and so temperature.
- The greenhouse theory has a fictional atmosphere with no mass, no mechanism for convective currents and models it as a single temperature.
In short the “greenhouse” gas theory is not only wrong in name (greenhouses don’t work the way suggested) but it is wrong scientifically and no wonder so many people look at it and think it is BS.
To help understand the real atmosphere, I’ve shown a model below. In this atmosphere the temperature drops as we rise up from the ground according to the lapse rate (or as shown: adiabatic lapse rate – which ignores rain). The model then says that if we were to look at the source of most radiation (or at least the part active in Greenhouse warming), then most of it comes from the top layers of the atmosphere (although in reality as 90% of the atmosphere is in the troposphere, this “top” is quite low down in the actual atmosphere.)
So, the temperature of the top surface of the atmosphere can be calculated by assuming its a black body and that temperature comes out at around 255C. The surface is measured at around 288C. This shows that the temperature drop due to potential energy loss of energy moving from ground surface up to radiative surface equates to an average around 33C. This is what is called the “greenhouse effect” (wrongly)
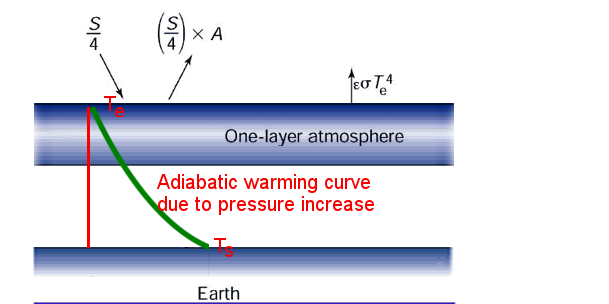
Removing all the irrelevant components from the Penn State “opaque atmosphere” model, we are left with the above.
The effect of CO2
With the addition of one extra piece of information, we can now work out the effect of changing CO2 – or at least work out what it means for the atmosphere. That extra information is the lapse rate of 6.5C/km.
I’m now going to work out the effect on the atmosphere of two levels of CO2 change. The first is the effective change in temperature due to CO2 over the 20th century which is around 0.15C. The second is the supposed change with a doubling of CO2 levels which is usually stated as 1C. However, using latest HITRAN database figures Herman Harde came to a figure of around 0.6C, which for convenience I’m calling 0.65C (if you disagree, then the maths might even be possible for Climate Extremists! – so most can do it themselves)
And what is that effect? If the earth rises by 0.65C, then this means the greenhouse effect must change by 0.65C, but as the above diagram shows, the greenhouse effect is the same as the total lapse rate from surface to effective top. So the total lapse rate must increase by 0.65C, but because the lapse rate itself doesn’t change, this means the effective top of the atmosphere will change and we can work this out as follows:
= temperature change/ lapse (meters)
= 0.65/6.5 = 100m
(I told you even climate extremist might be able to do it).
What this actually means is that because there is more gas to EMIT radiation (note we are not talking about absorption but emission), because there is more CO2 gas, there are more ways for CO2 higher in the atmosphere to emit direct to space. Or to put it another way, yes, some IR from lower down is blocked, and there is more emitted from the denser level of CO2 higher up. So, in effect the height from which the average IR is emitted rises. (If that still is not clear, think about looking down into the atmosphere like looking into a wood – the thicker the wood the less far you can see into it – so the less far we can see down into the atmosphere at the CO2 bands from outside – and hint: we see by light coming from the object we see)
And what has been the current effect for CO2 change leading to 0.15C warming?
=0.15 / 6.5 = 23m
Thus the entire effect of the total CO2 into the atmosphere so far, is equivalent to going up from the ground to the roof of a modest block of flats. This is the dramatic “change” that is supposedly destroying the earth! The equivalent of making the atmosphere 23m thicker. And the total change for doubling CO2 – that horrific doomsday event? About the same as going from the top of Big Ben on the UK parliament down to the ground! (I must look next time I go to London to see all the dead bodies caused by that massive temperature change!)
Note: this article is similar but not the same as the WUWT article: The Height Of Temperature Folly
[And to be honest, I believe Anthony Watts still does not understood how the actual greenhouse process works. As a result he still seems to think those talking about the lapse rate are nutters. OK, some clearly are “difficult”, others I have no idea what they are going on about, but … hey without the sensible ones I too would never have understood it myself and – I think I can forgive Anthony this one as we can’t all be perfect, all the time]

I think this explains it in more detail:
http://joannenova.com.au/2015/10/for-discussion-can-convection-neutralize-the-effect-of-greenhouse-gases/
Nice article.
Yes, more detail, but when we’ve still got people like Anthony Watts who seem to think adiabatic warming and the greenhouse effect are completely different planets, we still have some way to go, so I like to keep it very simple.
The main point of the article was to help those who don’t yet get it, that the “advanced theory” or “lapse rate” … or whatever it is, is the same as the greenhouse theory in what happens, but the mechanism of this advanced theory is much closer to a real atmosphere whilst that of the “Greenhouse” theory is what I call “noddy science” (it should be let out of infant school).
Why is it sceptics are never sceptical when it comes to papers they *like*? And why – despite being told they have the basic *facts* wrong – they can rarely assimilate these facts?
You write – “However, using latest HITRAN database figures Herman Harde came to a figure of around 0.6C..” Your statement is untrue now – just as it was untrue when “Advanced Two-Layer Climate Model for the Assessment of Global Warming by CO2” was published in 2014 (or pre-published in 2013). In fact, this was pointed out to you in a comment here back in 2013 which you apparently ignored. Even back in 2012 the *latest* HITRAN data was HITRAN 2012 – not HITRAN 2008 that Harde used. So calling it the “latest HITRAN database” was incorrect then and more egregiously incorrect today – since HITRAN 2012’s existence has been pointed out to you before.
The HITRAN factual details are interesting only in what they say about your ability to assess and assimilate information. Whether Harde used HITRAN 2000, or HITRAN 2008, or HITRAN 2012 is irrelevant. His errors have nothing to do with changes in HITRAN, but everything to do with failing to understand that a simplified model with give modest results. Harde’s effort has been shown to be uninformative.
Harde was published by a known predatory publisher. His ideas are scientifically uninteresting. No one that actually does this type of science for a living takes his paper seriously. It’s not even ‘interestingly wrong’ enough to deserve a published rebuttal.
All of this is known to you – or should be,. So where is the scepticism of the Harde paper?
Oh come on, is the latest data being used by the IPCC? Yes or no!
I know of two calculations, one Harde and the other the IPCC. I don’t know why or even if the later HITRAN can be used and I’ve certainly no idea why anyone would use an earlier version unless they were intentionally trying to mislead.
From my point of view, all I can really say with certainty, is that Harde is using a later HITRAN version than the IPCC and that is the latest I know that it suitable.
In other words, as far as I can see the IPCC are being intentionally dishonest by using an out of date version and only because it gives a higher figure.
And you sir, are supporting those fraudsters.
“I know of two calculations, one Harde and the other the IPCC. ”
Seriously? The IPCC doesn’t calculate anything per this subject as far as I know. They only cite and summarise the relevant scientific literature. Where can I find this IPCC calculation that you claim to know of?
As for: “…is the latest data being used by the IPCC? Yes or No!” Obviously you think you already know the answer. You don’t even express it as a question, but with an exclamation point. Yet the HITRAN 2008 data (the dataset used by Harde) was incorporated into LBLRTM back in 2011. So, is the HITRAN 2008 data used by Harde used by the IPCC? The answer is, a qualified Yes! Qualified that all model runs using the updated LBLRTM would be using HITRAN 2008 (with some slight improvements made by the LBLRTM team).
The one the IPCC quote from Hansen. But since the IPCC are just borg collective – there is no alternative view is there!
Oh just show me any paper using a later version of HITRAN than Harde or stop wasting my time.
As was pointed out over a year ago when the paper first came out:
Figure 1 from Harde’s paper in the Open Journal of Atmospheric and Climate Change
versus Actual data for relative humidity calculated from AIRS satellite data from the NASA Giovanni DAAC
A *real* sceptic wouldn’t ignore this huge discrepancy between Harde’s model and actual observations – much less keep promoting a paper that was so quickly found to be faulty.
Did Harde use a later version of HITRAN yes or no?
The answer is that amongst all works, his uses the latest version of HITRAN.
I also corresponded with the author regarding the HITRAN WHERE HE IS AN EXPERT and he explained that the later version had more reference frequencies and this appeared to be the reason he was getting lower results.
So, thanks for the links, but it isn’t relevant.
If his model is superior – then why are his relative humidity values off by factors of 2 or more? He has relative humidity increasing with altitude – which is the exact opposite of the real world data/observations. Since water vapor is the most prevalent GHG one might think this to be a very serious problem.
Why do you ignore this discrepancy? Does a sceptic ignore inconvenient data?
The model hardly matters at all. The main thing causing the lower value of Harde is the database and not the model.
So you are just being a dipstick.
Pingback: New study suggests 0.14C warming for doubling of CO2 | Scottish Sceptic
I like your explanation and method. It’s intuitively pleasing to me. I’ve seen similar calculations predicting the temperatures on other planets so it seems to generalize well.
What I don’t understand is how the down welling calculations also seem to give reasonable numbers for earth anyway. If the physics are wrong how is the math working?
Never liked down welling. If the down well is even more than the solar radiation why is the hood of my car air temperature in the morning. I don’t get it.
Thanks for the comments a good question and when I wrote the article I might have had a quick answer.
My understanding is that a detailed analysis requires a much more complex model which is neither the “backradiation” model nor this one. In essence the atmosphere is divided into many layers and then the numbers are crunched.
What we then get is the “radiation flow” diagrams – which show flows – and these are falsely interpreted as “back radiation” and other processes – because it does not really matter what the flow is physically so long as the numbers match up.
Likewise, the above model also massively simplifies the atmosphere and e.g. largely ignores radiation flows within the atmosphere. However, these are included in the “lapse rate” – because this is only maintained through heat flow (and various IR flows).
So, either way there are massive simplifications. But the main difference is that the “heat trapping” theory is just anti-science as CO2 doesn’t just absorb IR but also emits it. That naturally causes many people to reject it. Also the heat trapping model is all focussed on the surface – which is highly problematic there’s no explanation as to how the heat makes its way through the dense lower atmosphere to where it can escape. And as a result the heat trapping model glosses over the importance of convection and how the atmosphere itself creates a temperature profile. Also, there’s no mechanism in the heat trapping model to move heat “trapped” in the atmosphere back down to earth (except the highly contentious “back radiation”). So, all in all, it might be a way to show the various heat flows but it contravenes much of the science we know.
In contrast the above model starts with a real atmosphere and a lapse rate – and this is what dictates the temperature drop – up to the the effective radiation height.
The advantage is that it (largely) separates the thermodynamic processes in the lower atmosphere (hence lapse rate) from the radiative processes causing heat to be lost – and it does so in a way that still shows the effect of adding of losing “greenhouse” gases.
Thanks, had to read a couple of times but I think I’m getting that both your calculations and the green house theory are “black boxing” the complex processes and getting essentially the same Earth result. Possibly at some abstraction level the flux measurements and lapse rates are related (rhyme) but expressed differently.
It surprises me still that after all these years there’s no agreement on the physics mechanisms. Shame to have wasted all the peoples money that could have been better spent actually studying and better understanding weather/climate. Or at least preparing for yesterday.
thanks again
Yes I think you understand. All models are by their nature simplifications. So in the strict sense they are all “wrong” in some way.
But the problem with the heat trapping model is that the behaviour shown in the model does not make scientific sense (unless you also understand what is hidden).
But it’s pretty obvious the heat trapping model is used as a propaganda tool by alarmists BECAUSE it focusses everyone on the effect of greenhouse gases – and because everything else is hidden in the model the implication is that CO2 = massive warming.
In contrast, the advanced model I show, shows a dynamic atmosphere where heat transport to the cloud layer is key to heat loss. Now CO2 (or other greenhouse gases) are just another cog in the wheel and e.g. the small increase in effective radiation height by adding CO2 could easily be offset by changes in cloud due to the implied change in heat flow to the cloud layer (which is approximately** the heat irradiating level of the atmosphere).
In other words, whenever any sceptic even mentions greenhouse warming and doesn’t explain the complex nature (as per this advanced model) they are helping to spread the alarmist propaganda that blows up the effect of CO2 out of all proportion.
**I add this note because I strongly suspect that the clouds form at the effective irradiative heat loss height because it is the clouds that emit the heat and the formation of clouds that transport the heat from the surface – but I may be wrong.
The family claims to be pre-revolutionary war Scot; regardless we’re now several generations Floridian. I’m also agreeing with you and Willis. Ocean..daytime Heat…Seabreeze…Thunderstorm…Cooling.
My other opinion is that winter generally erases the board of summer heat. Once the heat gets gone it’s not coming back until the sun heats it up again. Aka if there was a significant heat storage capability then a hot summer should correlate with a warmer winter. (never has for me) Winter seems to take what it wants.